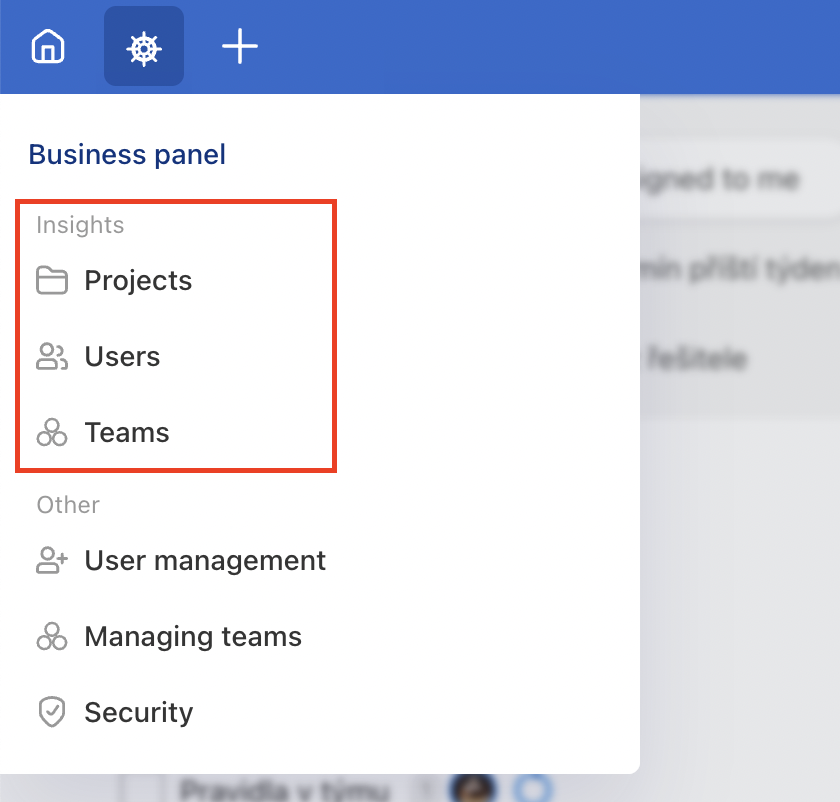
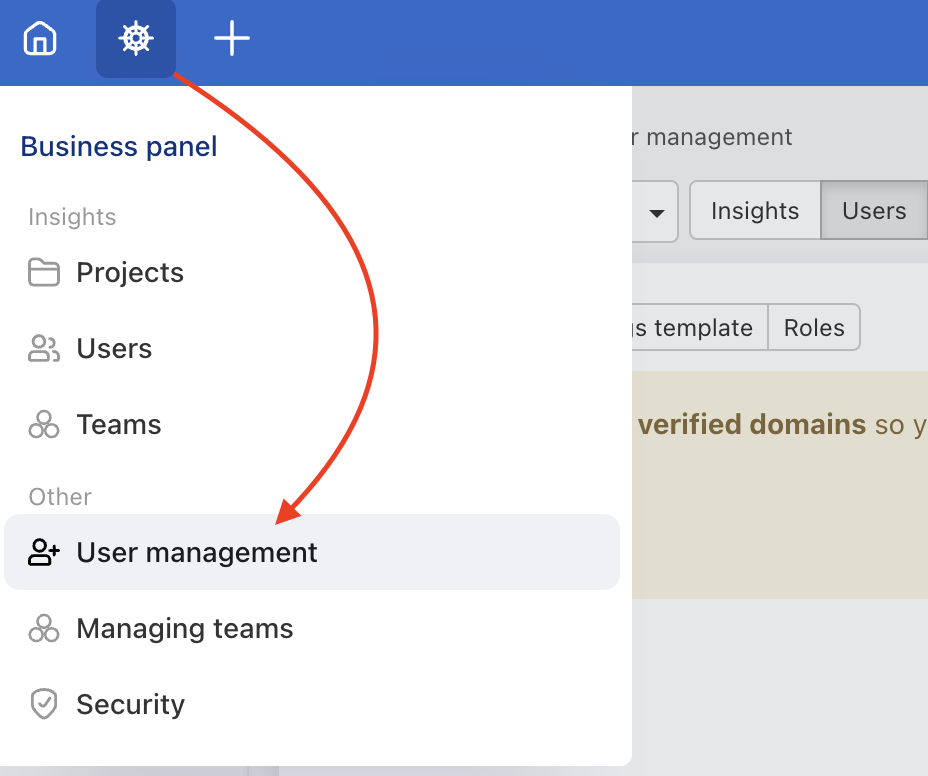
Insights is the first page in the Business panel. It brings 3 types of overviews:
The Business panel is available for the captain of the Business plan and appointed Company captains. In case you want to try its features, turn on the 14 days testing cruise.
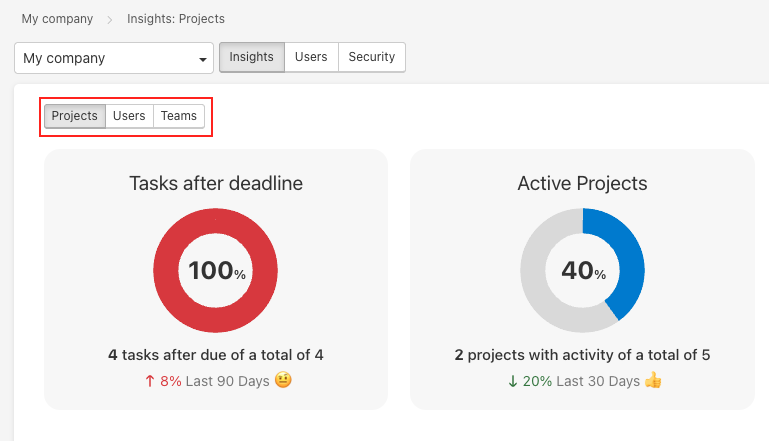
1. Projects
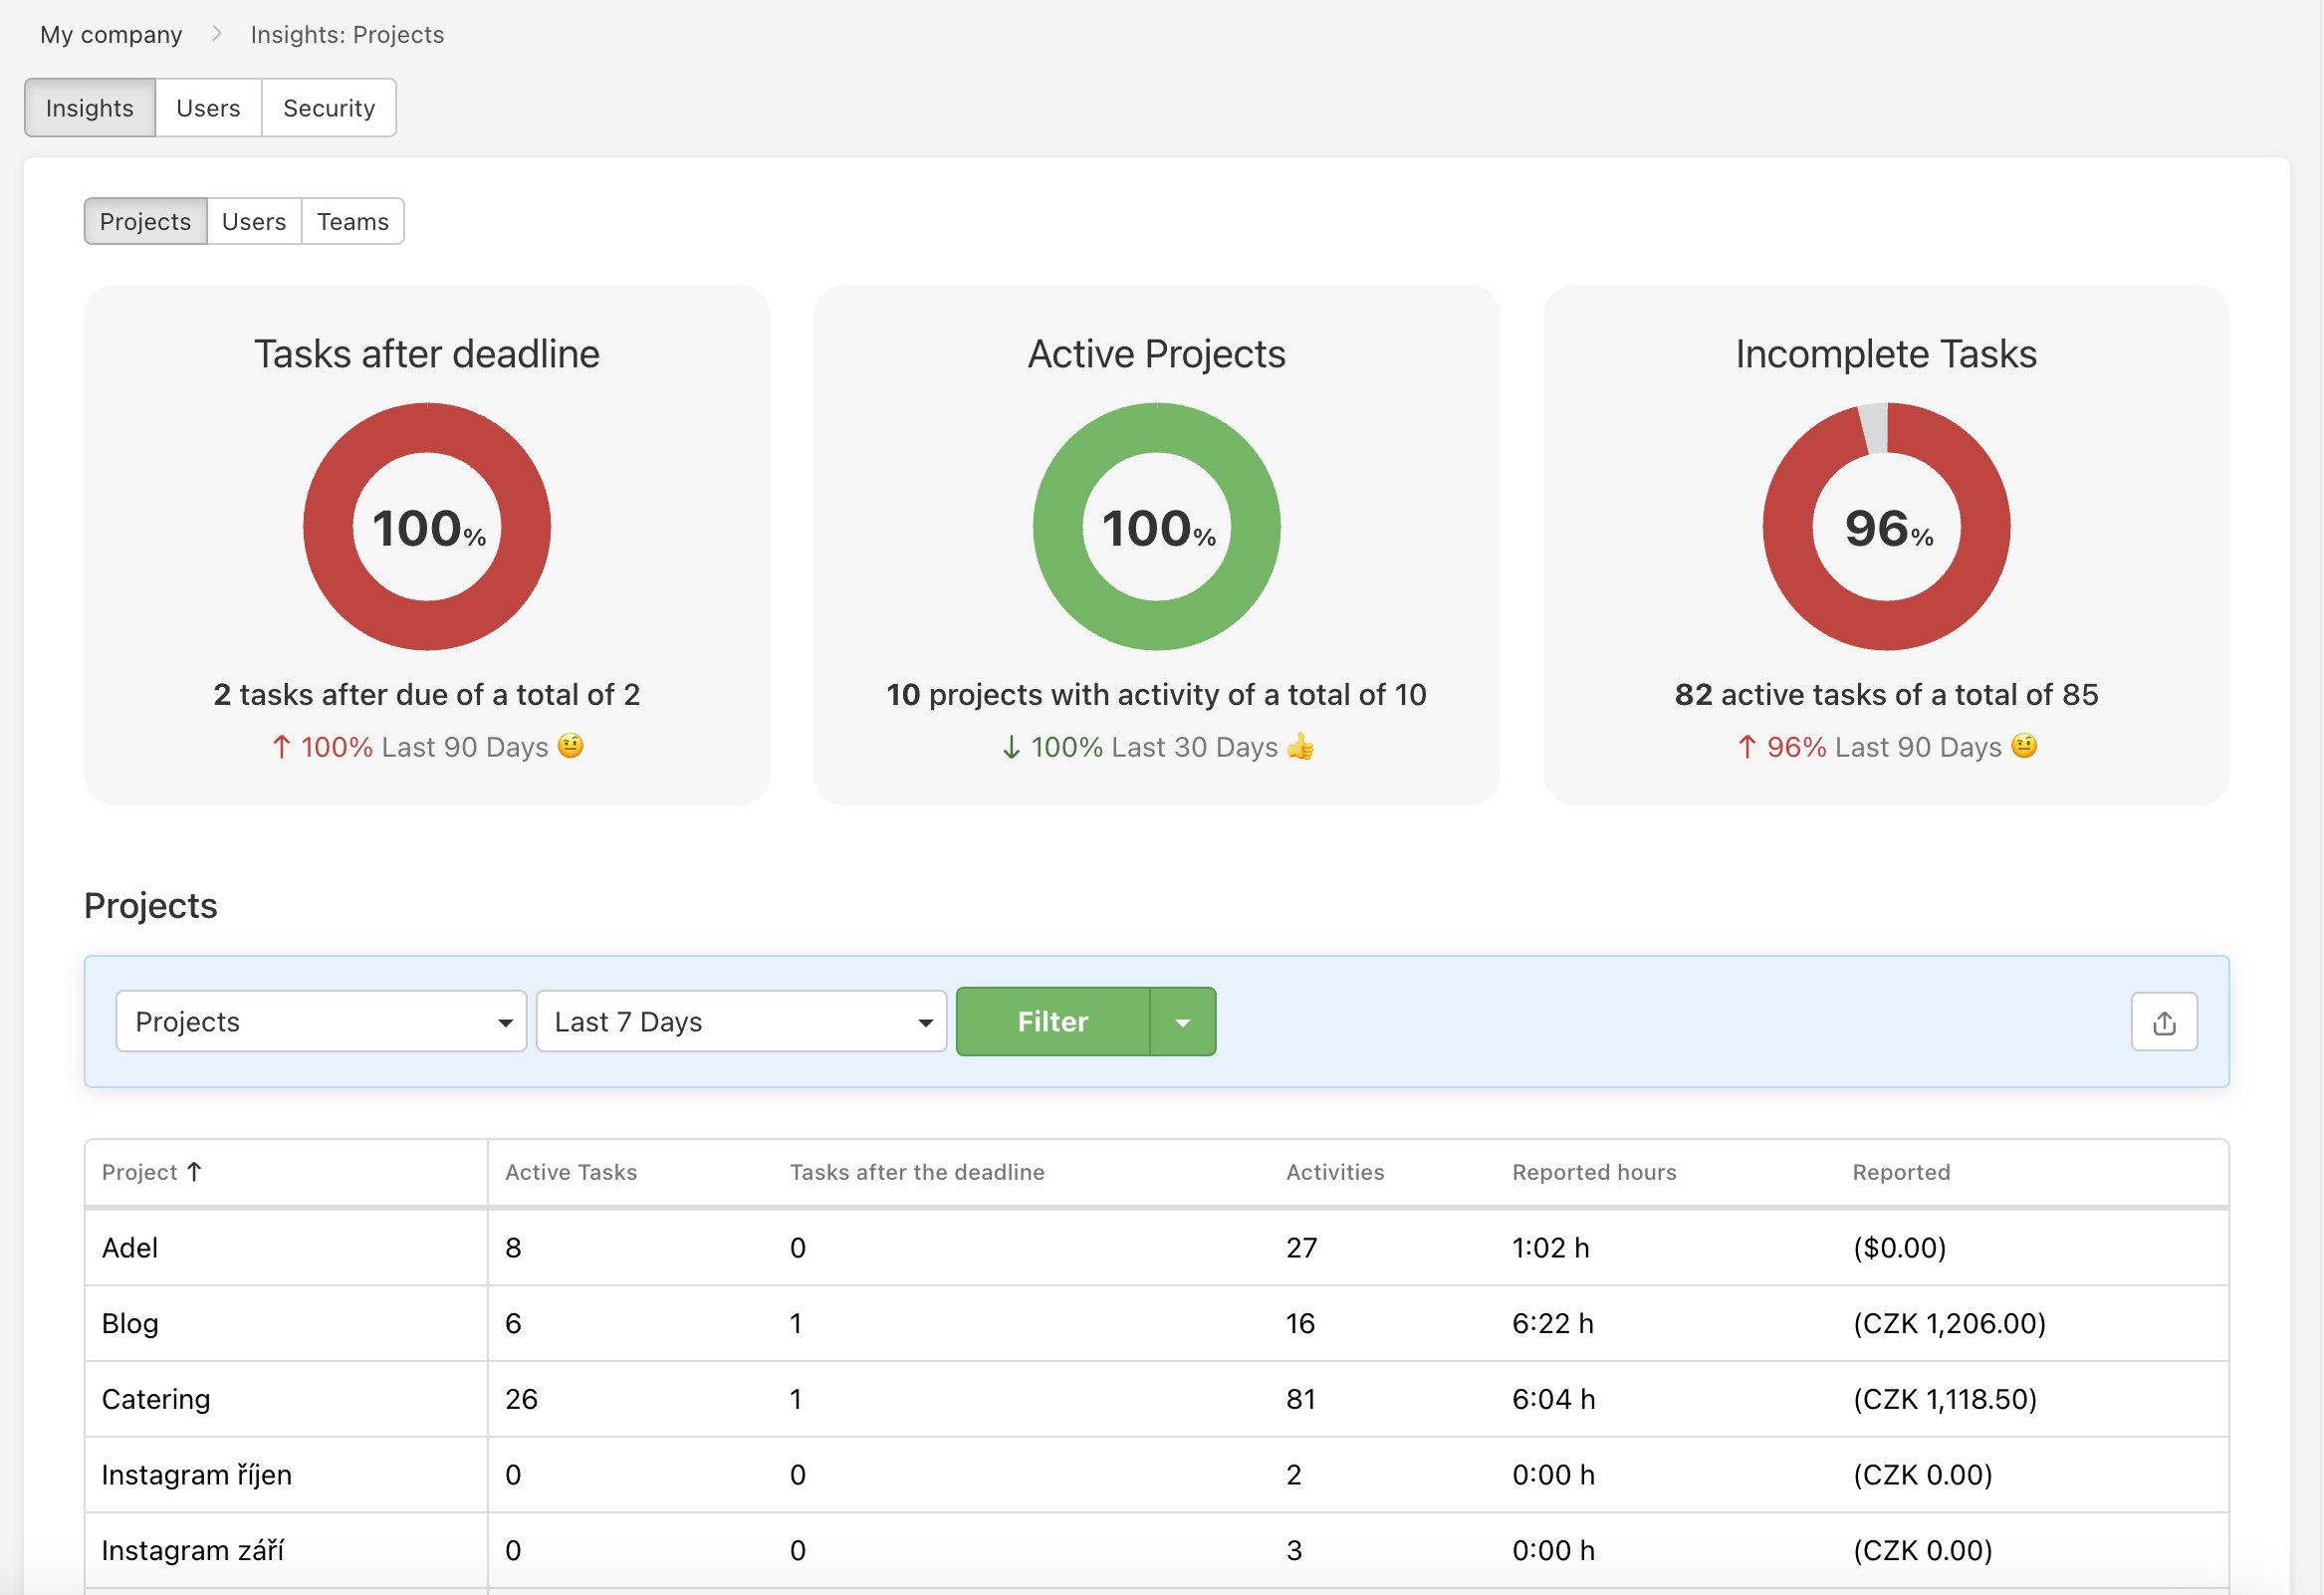
In the Projects section are only the projects you are the captain of. In the graphic view you can check:
- Tasks after deadline
- Active Projects
- Incomplete Tasks
My company
Within the filter My company you can see the information about your own projects. If another captain appoints you a Company captain, you can see insights over their team.
Select another company/team in Other companies.
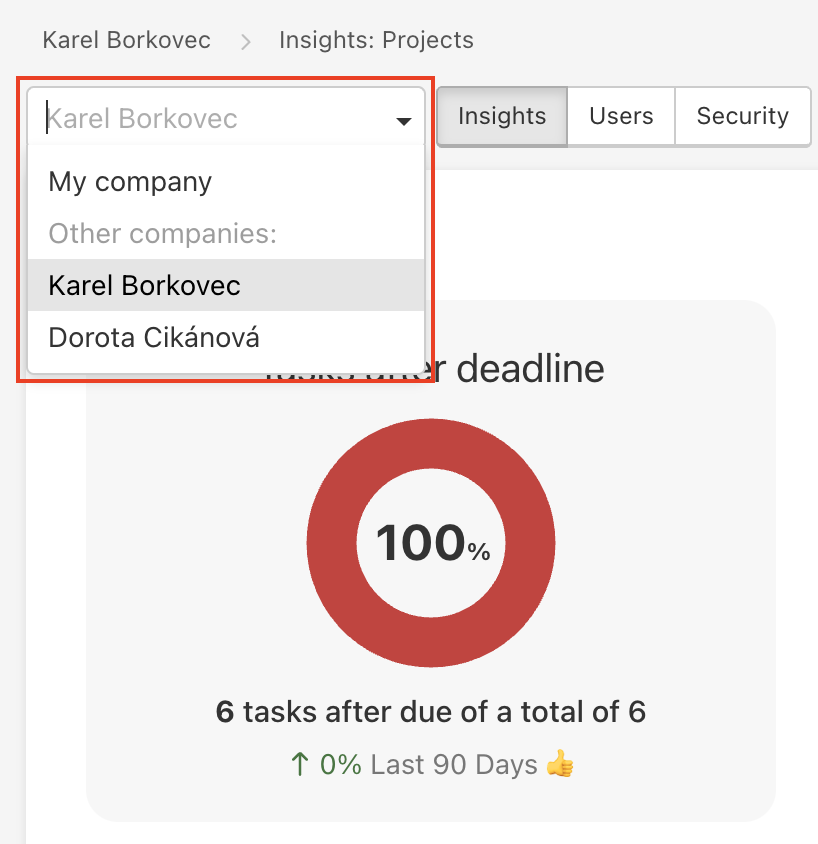
You can always see insights over one company, not all of them in a summary.
Activities in Projects
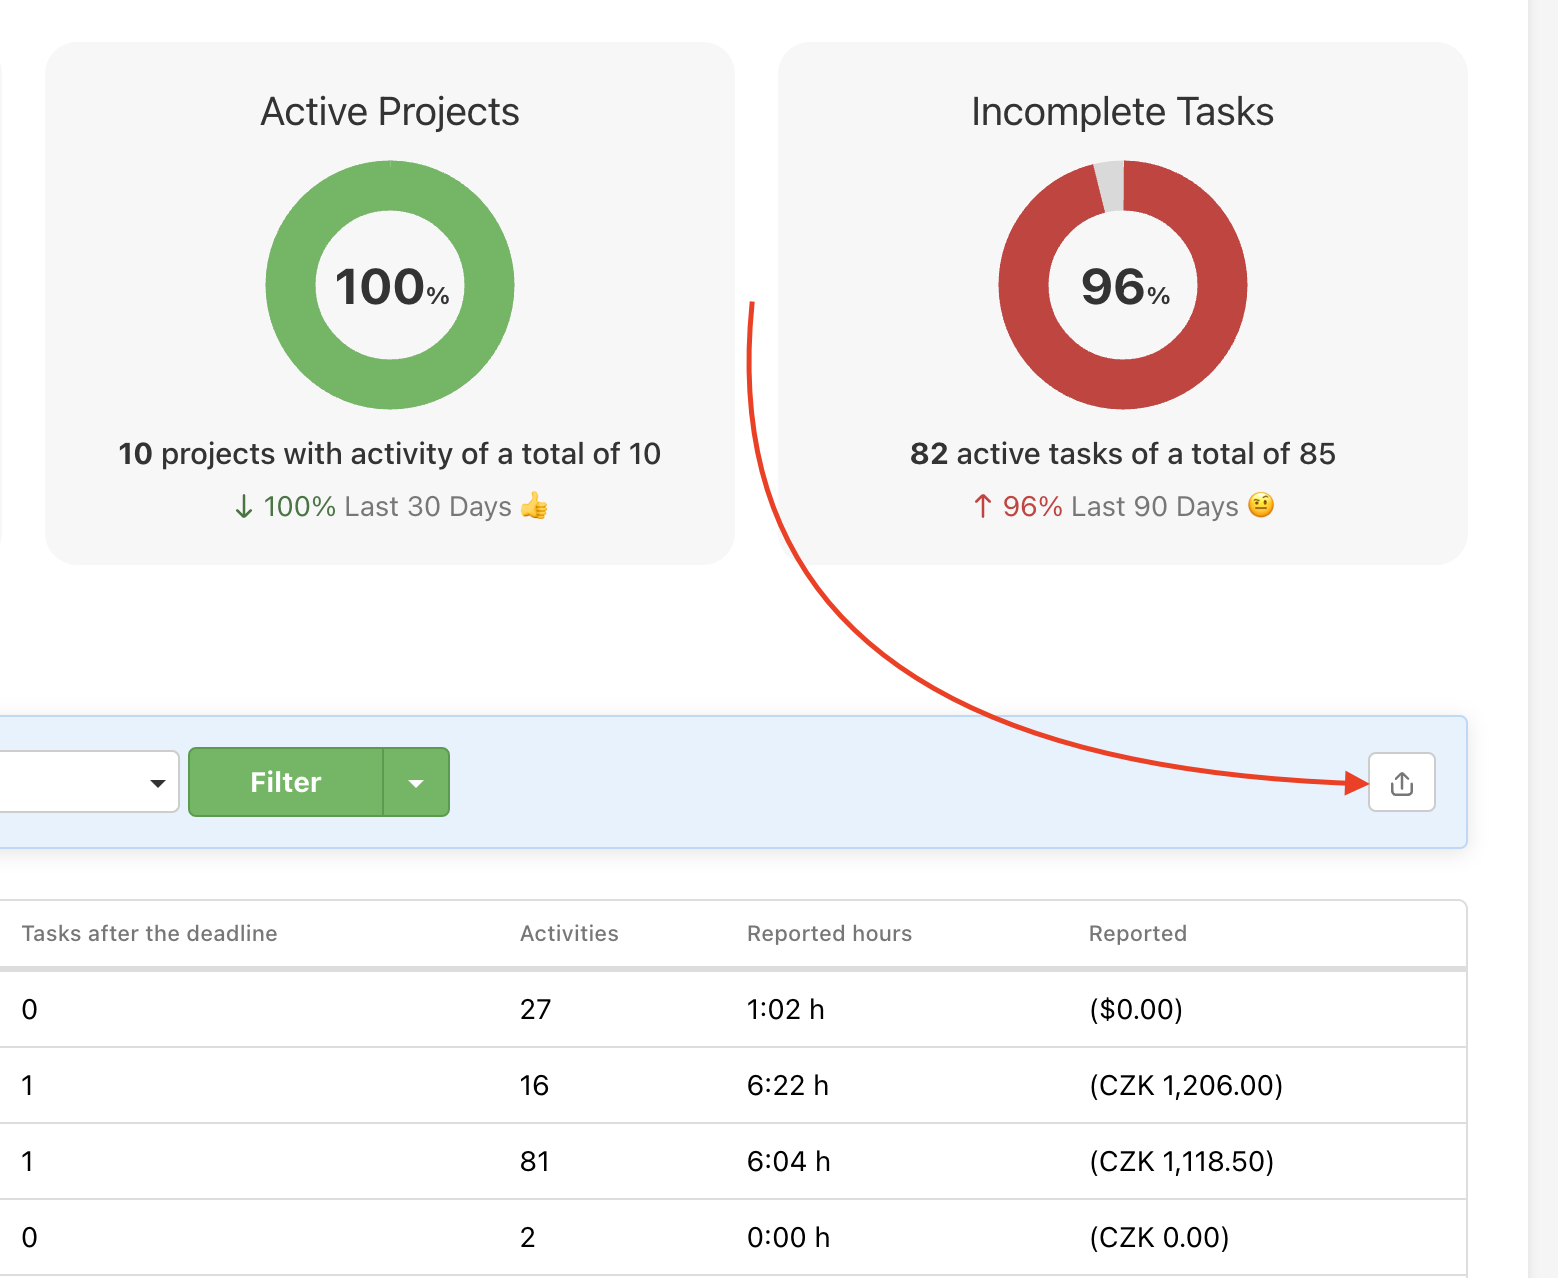
There is a list of your projects with insights. When clicked on, every value offers a detailed overview.
- Number of Active Tasks – project detail
- Number of Tasks after the deadline – opens Dashboard with filter for these particular tasks
- Number of Activities – opens a project activity report
- Reported hours – Weekly and monthly reports
- Reported costs – Weekly and monthly reports
Filter by time period
You can set which time period you want to check. Choose from 7, 30, or 90 days or a custom period.

Project export
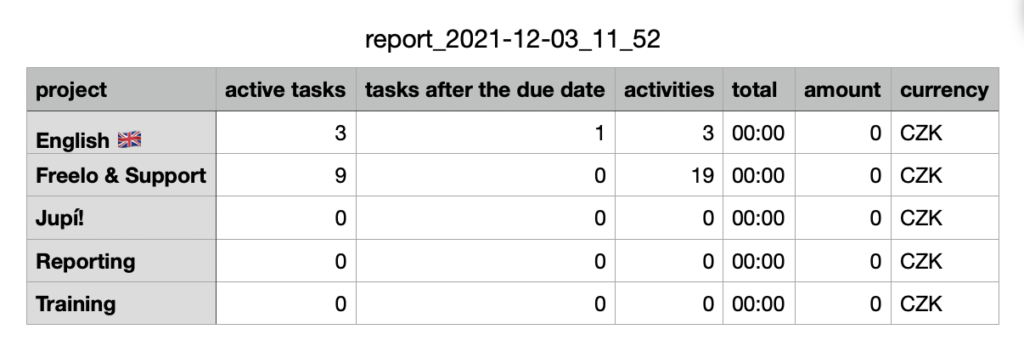
You can export the tab overview of the projects to CSV. It has the same form as the tab in Freelo.
Start the export via the icon Export next to the time filter.
2. Users
Here are the users invited to your company’s projects, or the users of another company in which you have been assigned the role of the Company Captain.
Users by Activities
The first overview shows the percentage of activity per user. That includes tracking the comments in discussions, completing tasks, creating tasks, due date changes, etc.
The overview tracks increasing and decreasing activity per user. The graph of Active Users shows user activity in the last 30 days and it is constant.
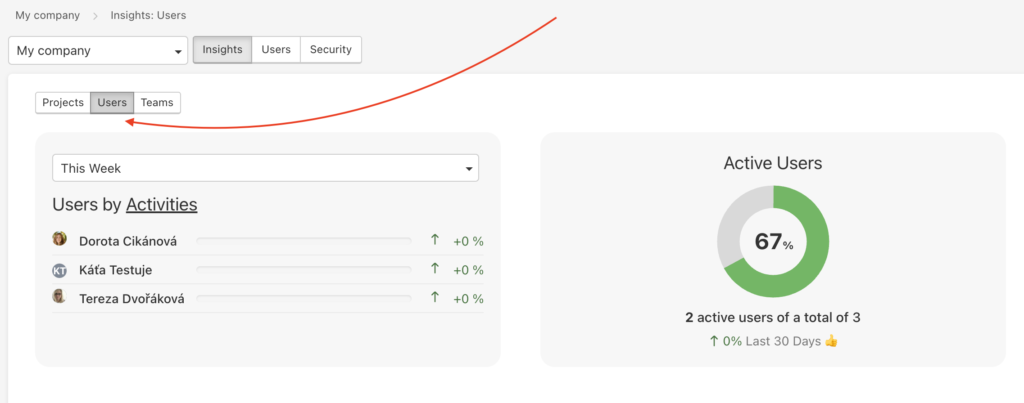
You can filter the time period you want to see.
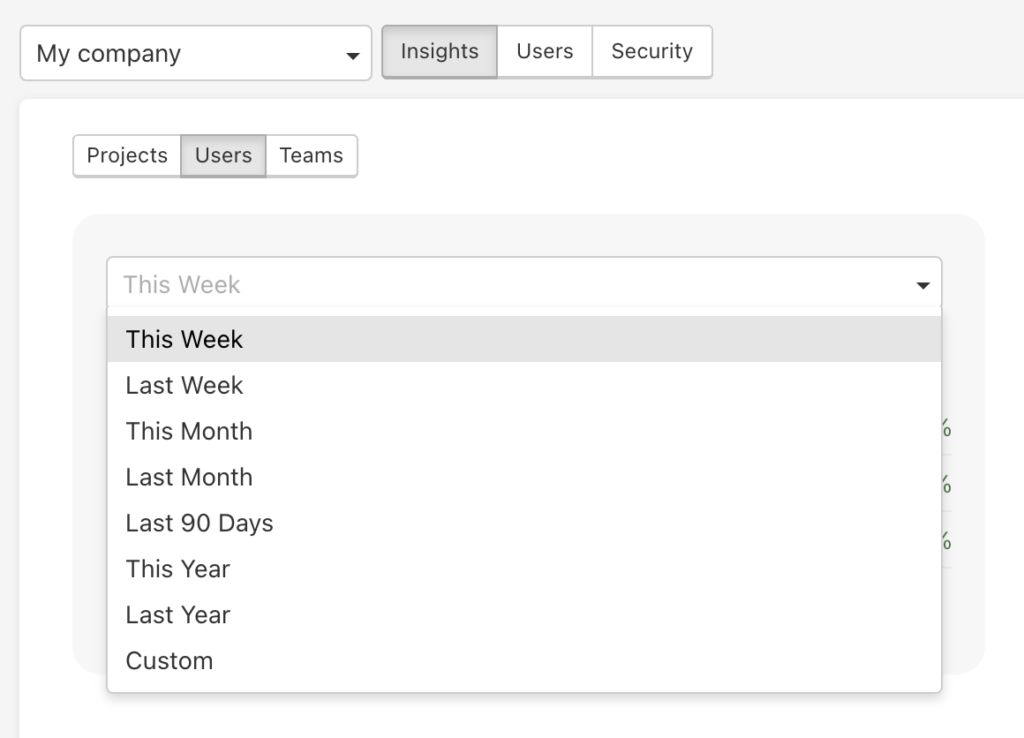
At the end, there are three overviews – Statistics, Time tracking, and Activities. You can export these data to CSV or set different time periods.
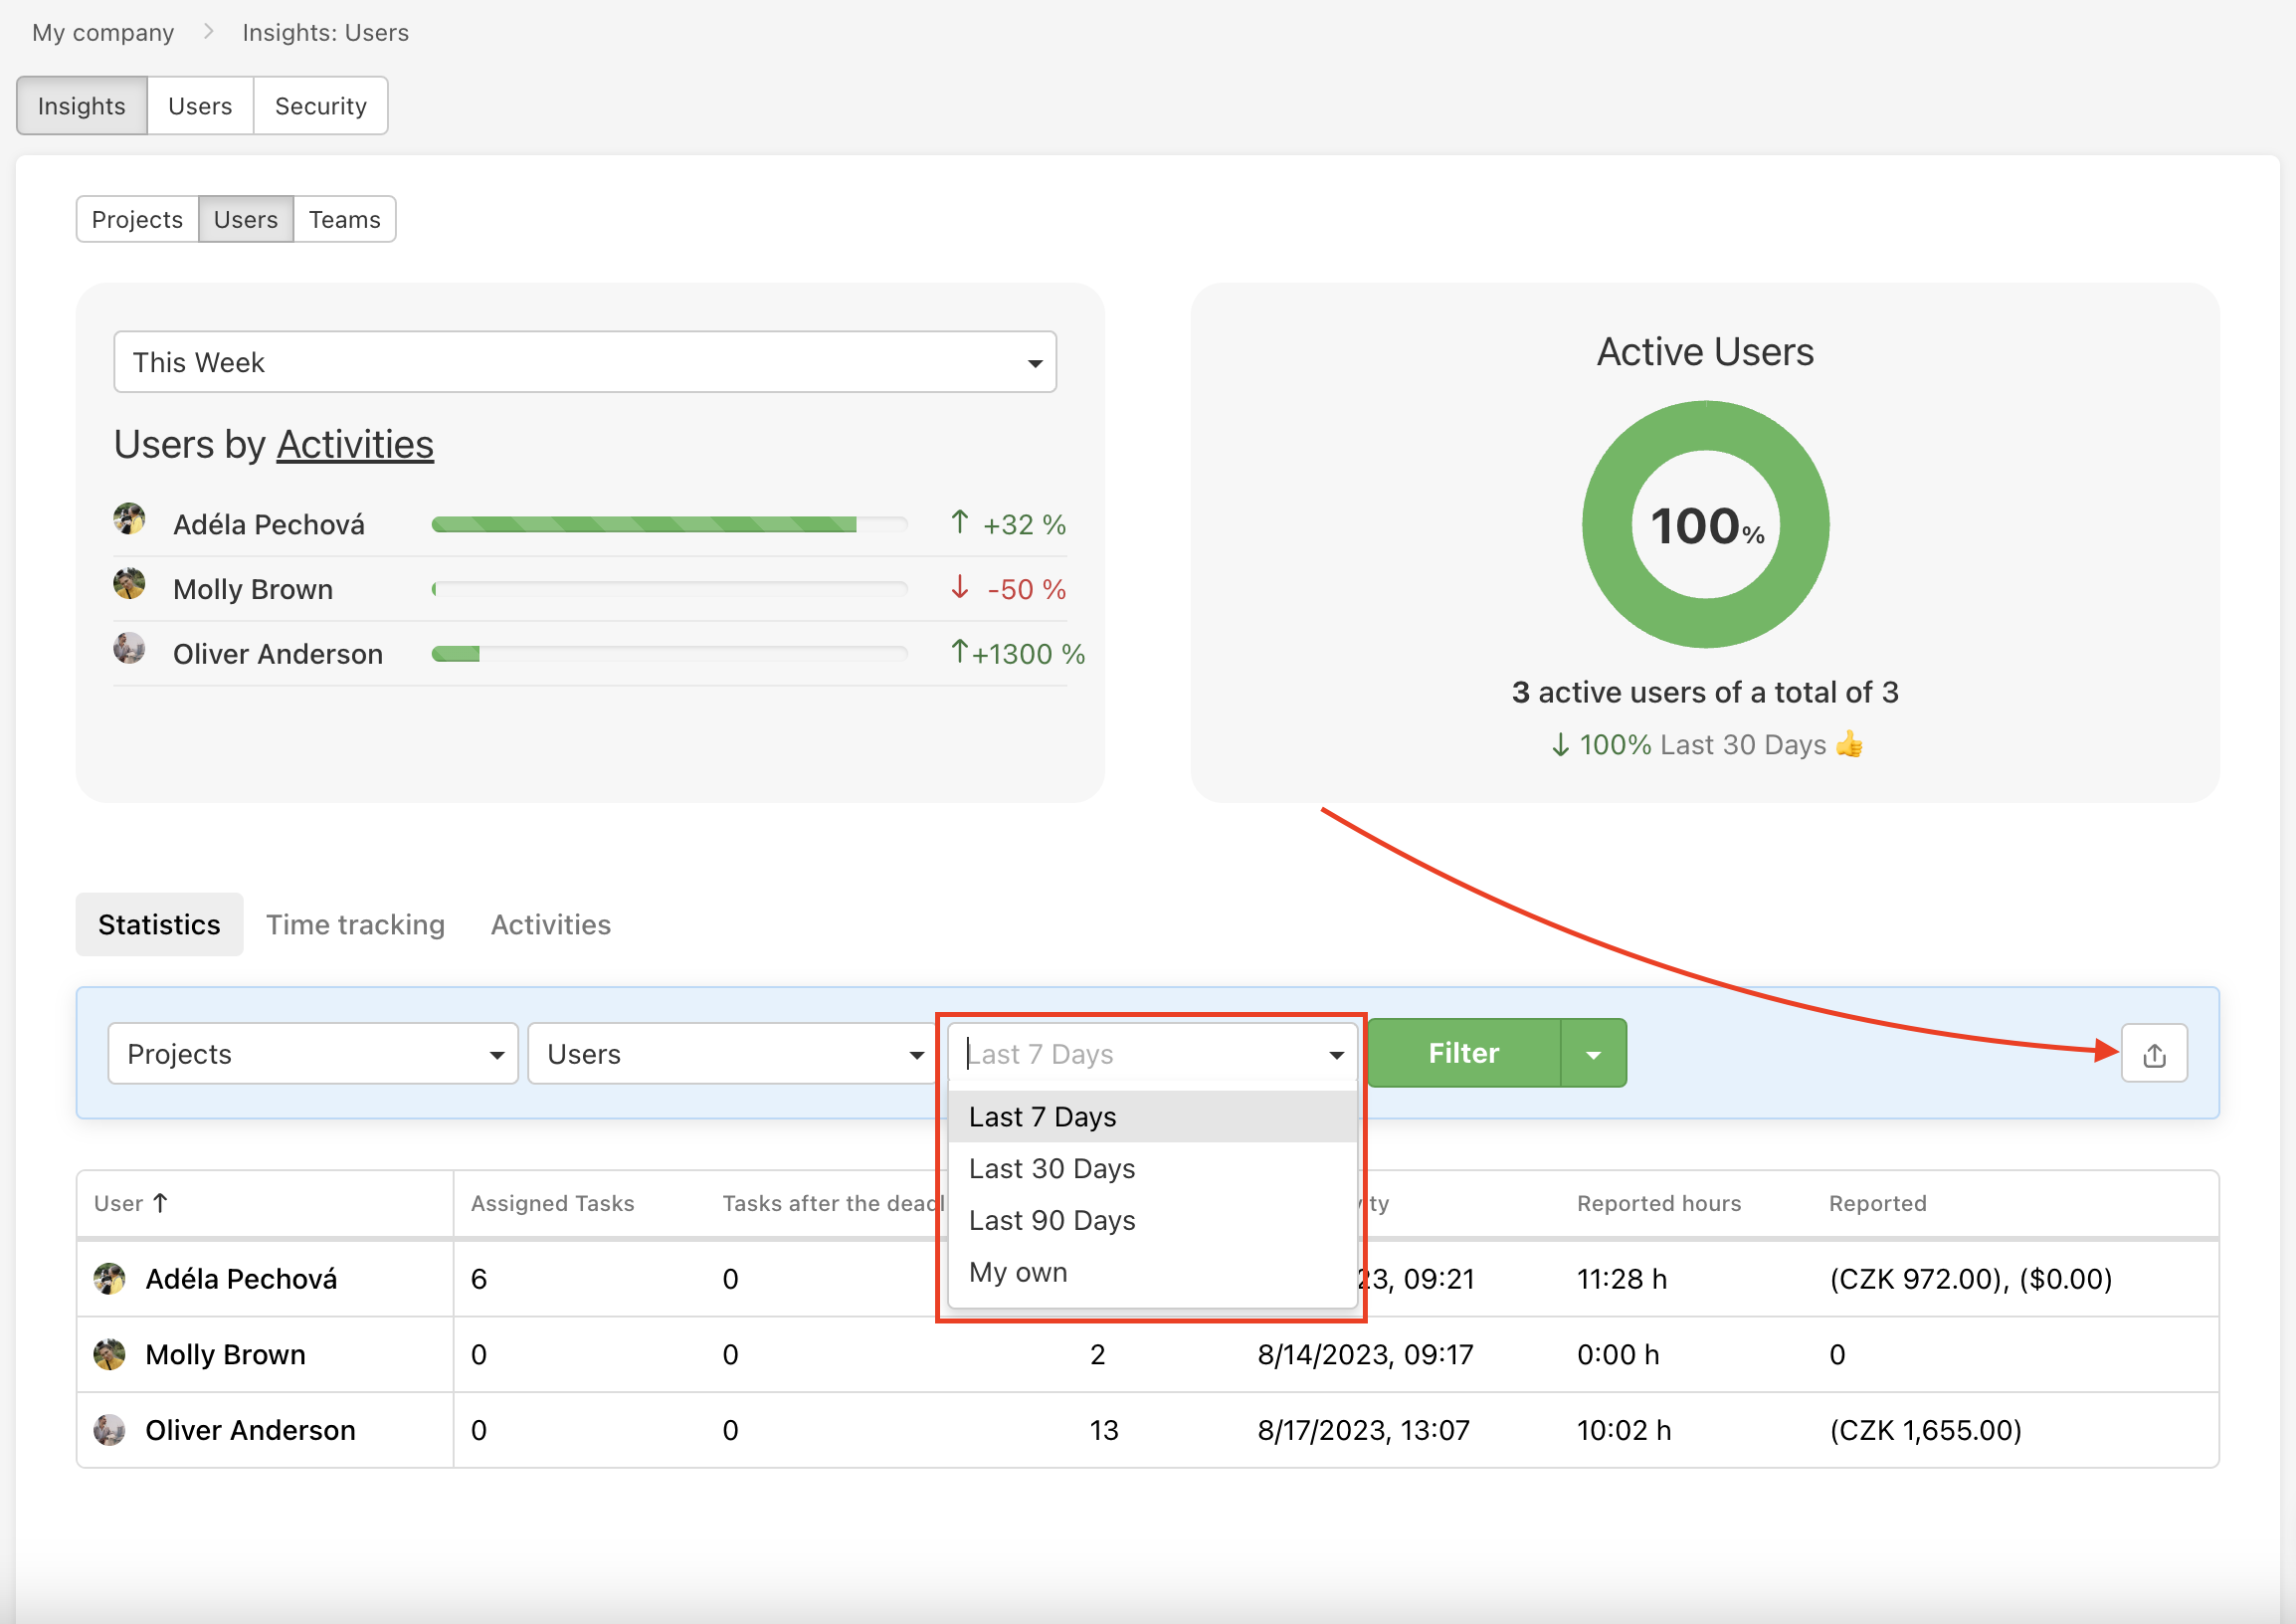
Statistics
Click the number in the tab and Freelo redirects you to the particular user. In Statistics you can see:
- Assigned Tasks – the number of tasks created in the selected period assigned to the user is displayed here; user’s profile
- Tasks after the deadline – shows Dashboard, where you can filter tasks by due date
- Activities – report of the latest activities
- Last Activity – also report of the latest activities
- Reported hours – see Summaries
- Reported costs – also Summaries

You can export the report to CSV.
Time tracking
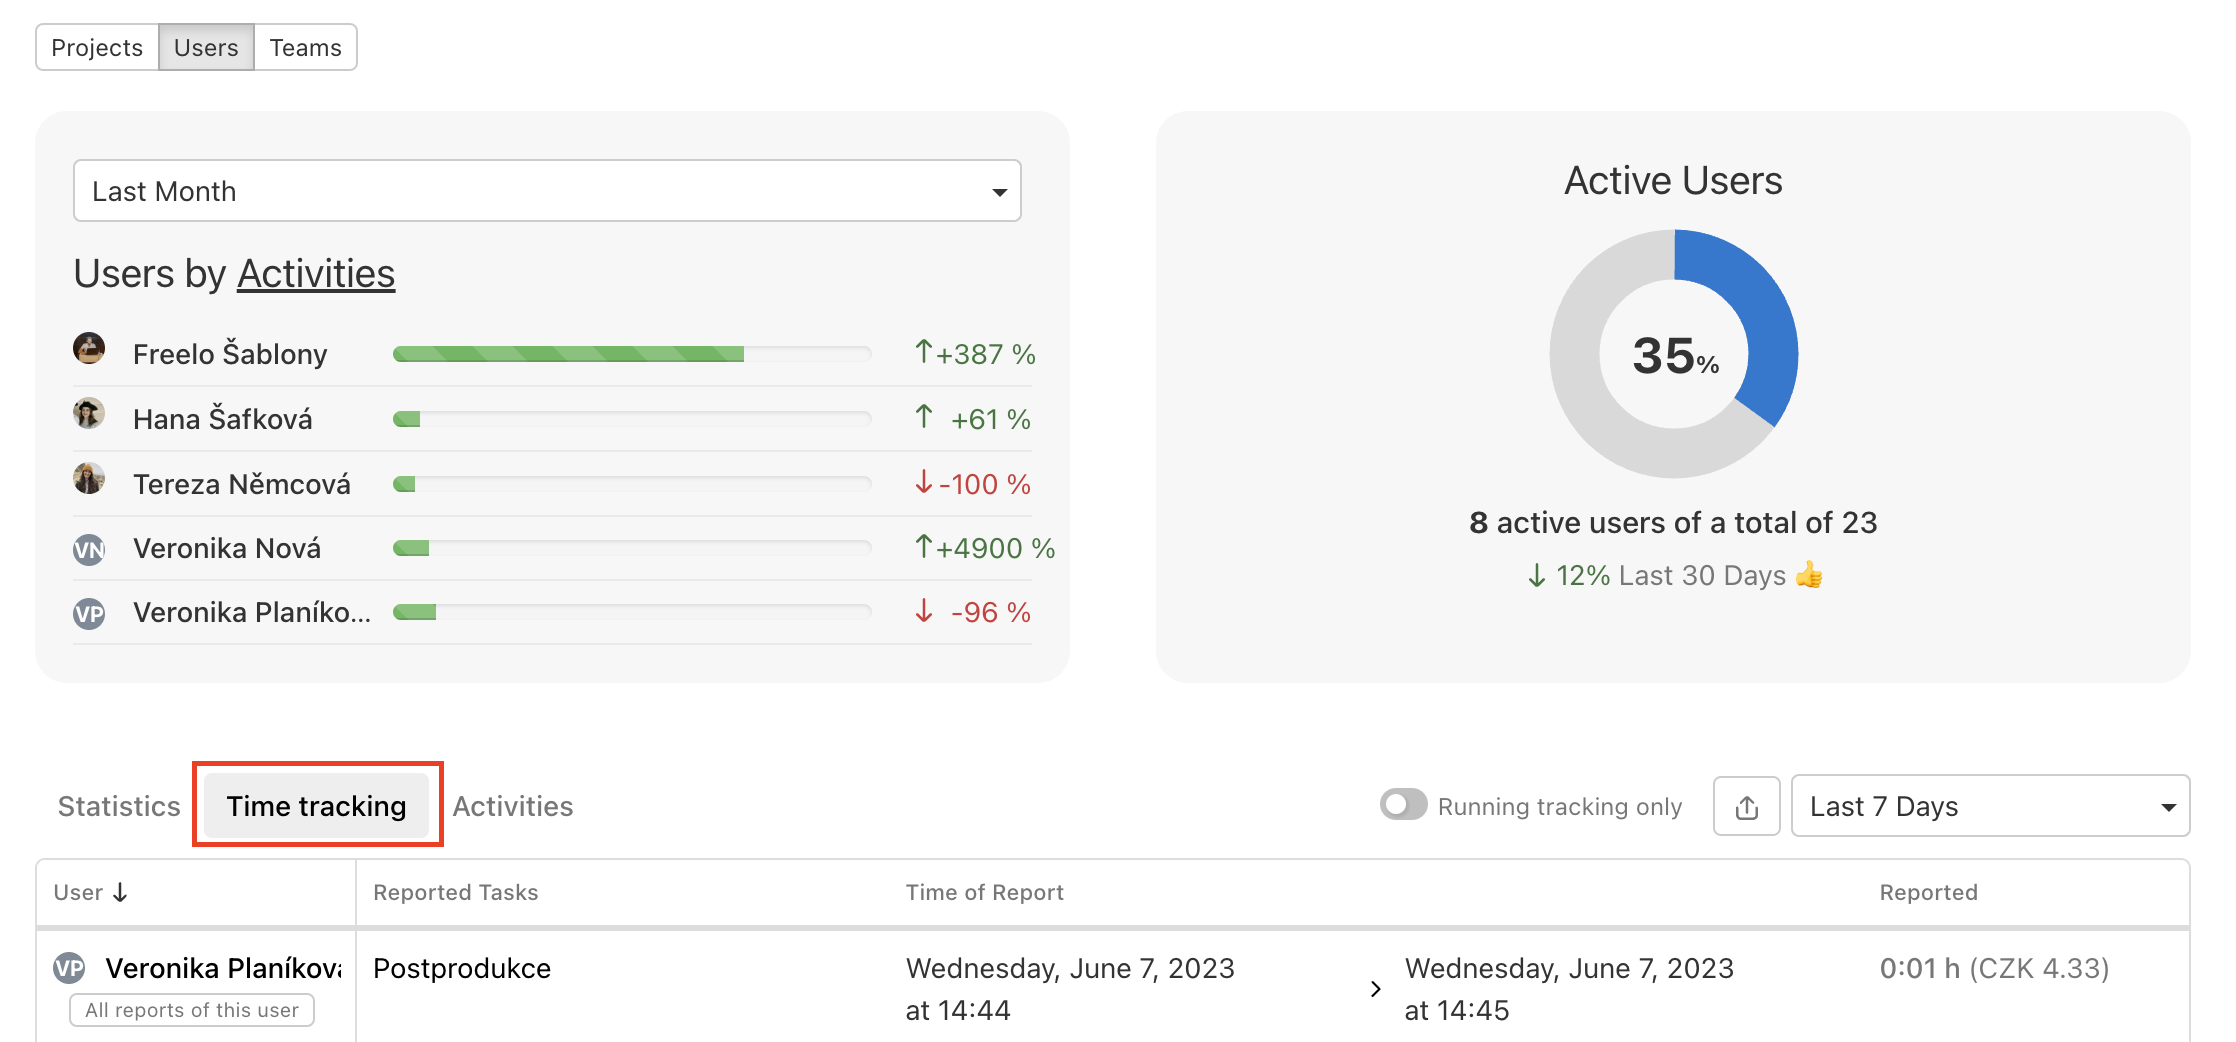
Within the Time tracking overview are the tasks, where the user reported time or cost the last time.
You can see:
- Reported Tasks – via keyboard shortcut Q you can see task detail
- Time of Report – start and end of tracking
- Running tracking – current running tracking
- Reported finances – you can check details in the Weekly and monthly tab
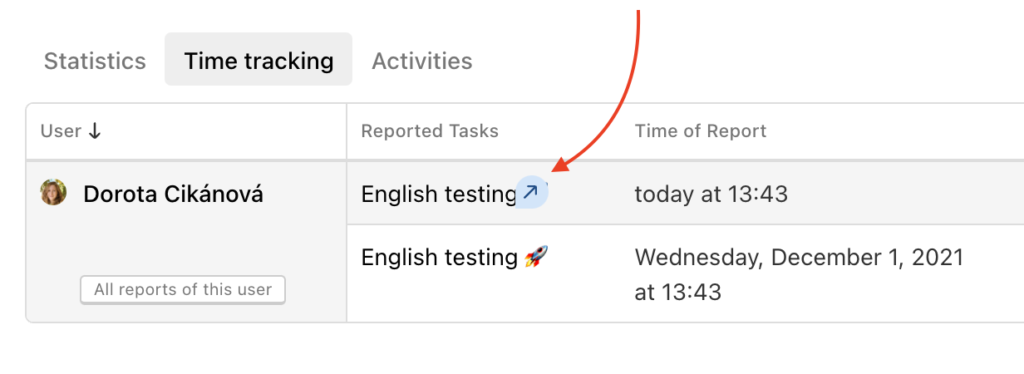
Go to the detail of the tracked task by clicking on its name, bubble with the arrow, or keyboard shortcut mouse over the task + Q.
If you are only interested in the current user measurements, just activate the Running tracking only feature. This will only show you a list of users who have time tracking enabled right now.

Users Activities
It is a report of the latest users’ activities in your project. Click the item and Freelo redirects you to the task detail. You can export the report to CSV. Click All activities of this user to see the report Latest project activities with a filter for a particular user.
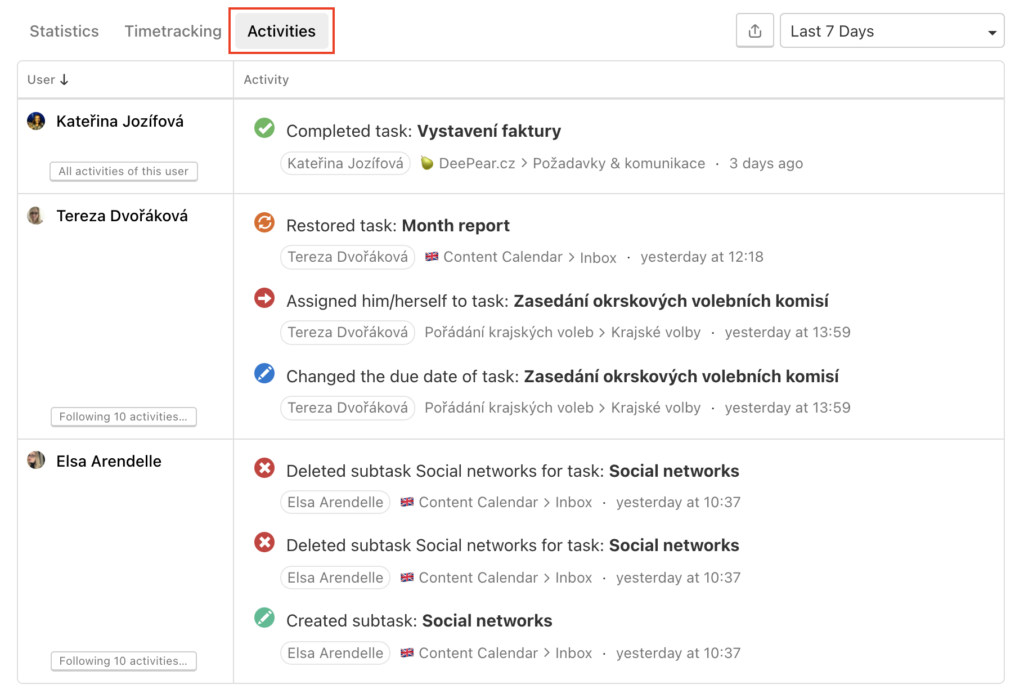
There is a maximum of 10 tasks visible > Following 10 activities…
Editing and setting a user
Editing personal information and setting notification e-mails is possible only when you verify the company domain. Click on the three-dot menu to edit the information.
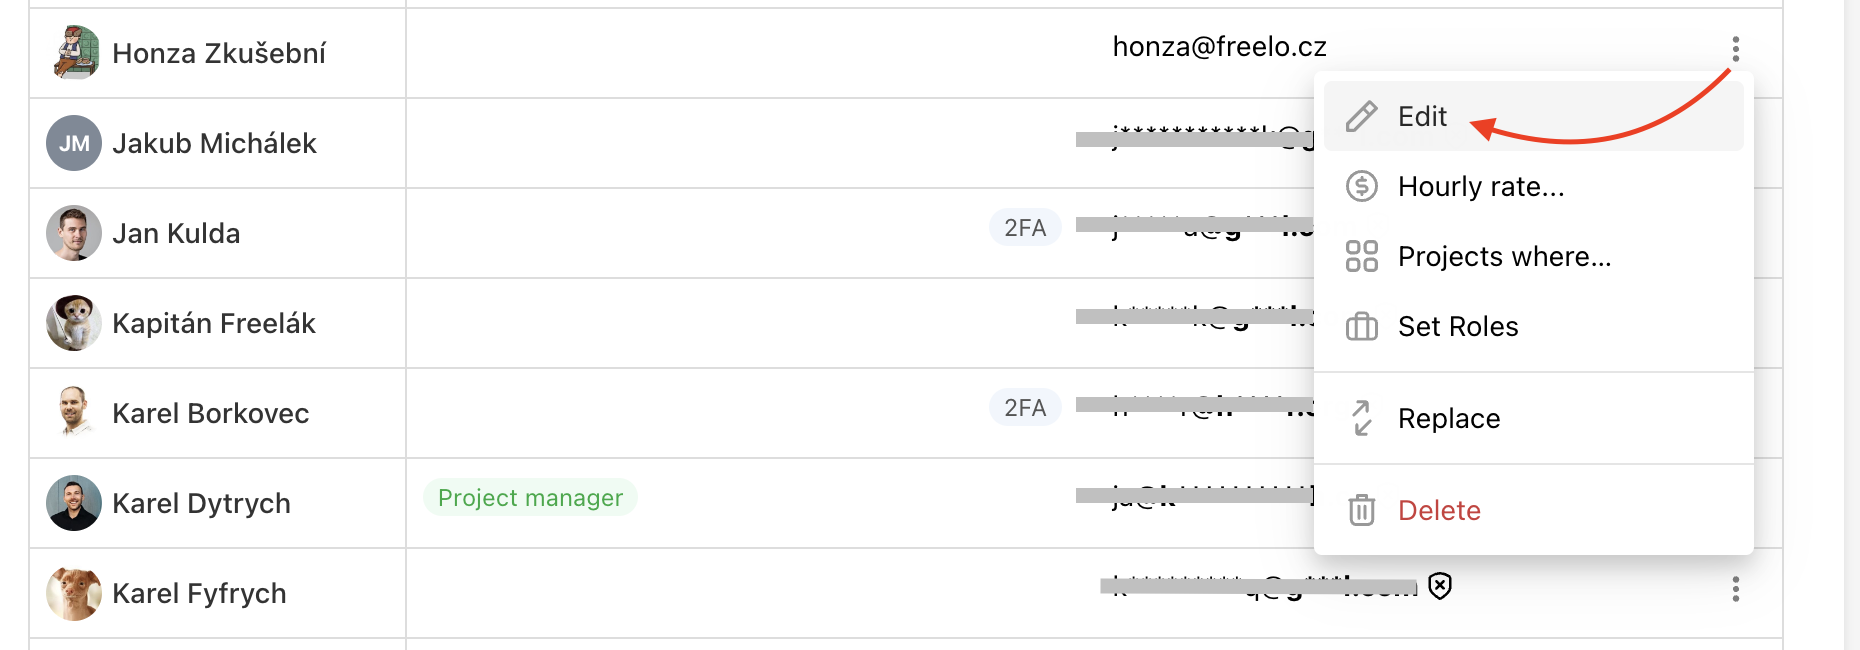
Editing Personal information
Thanks to the verified domain you can edit the user’s name and last name, avatar, and set the language.
To change the avatar (profile picture) click on Select picture and upload a square format. Confirm all changes by clicking on Save.
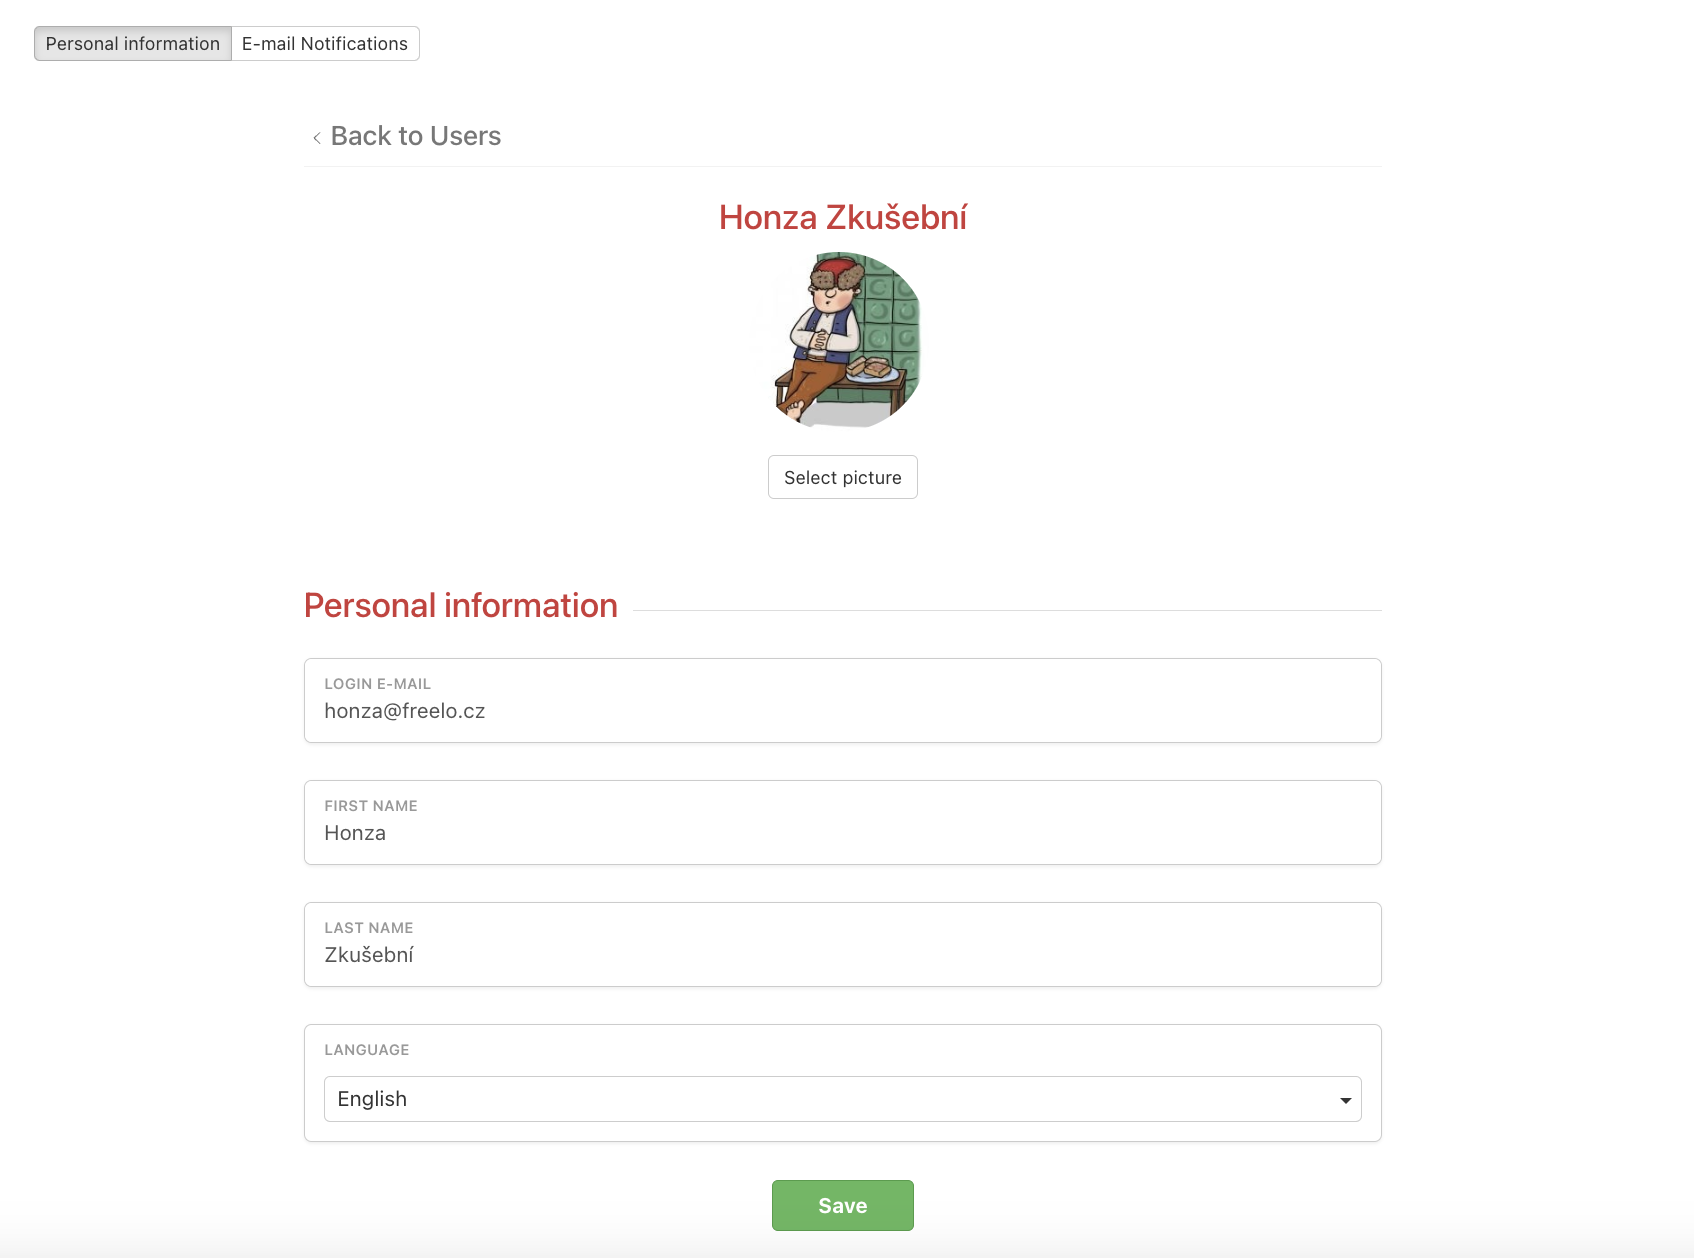
You cannot change the login email. If you want to change it, send us an e-mail to info@freelo.io with a login change request from your current login email.
Overview of active licenses
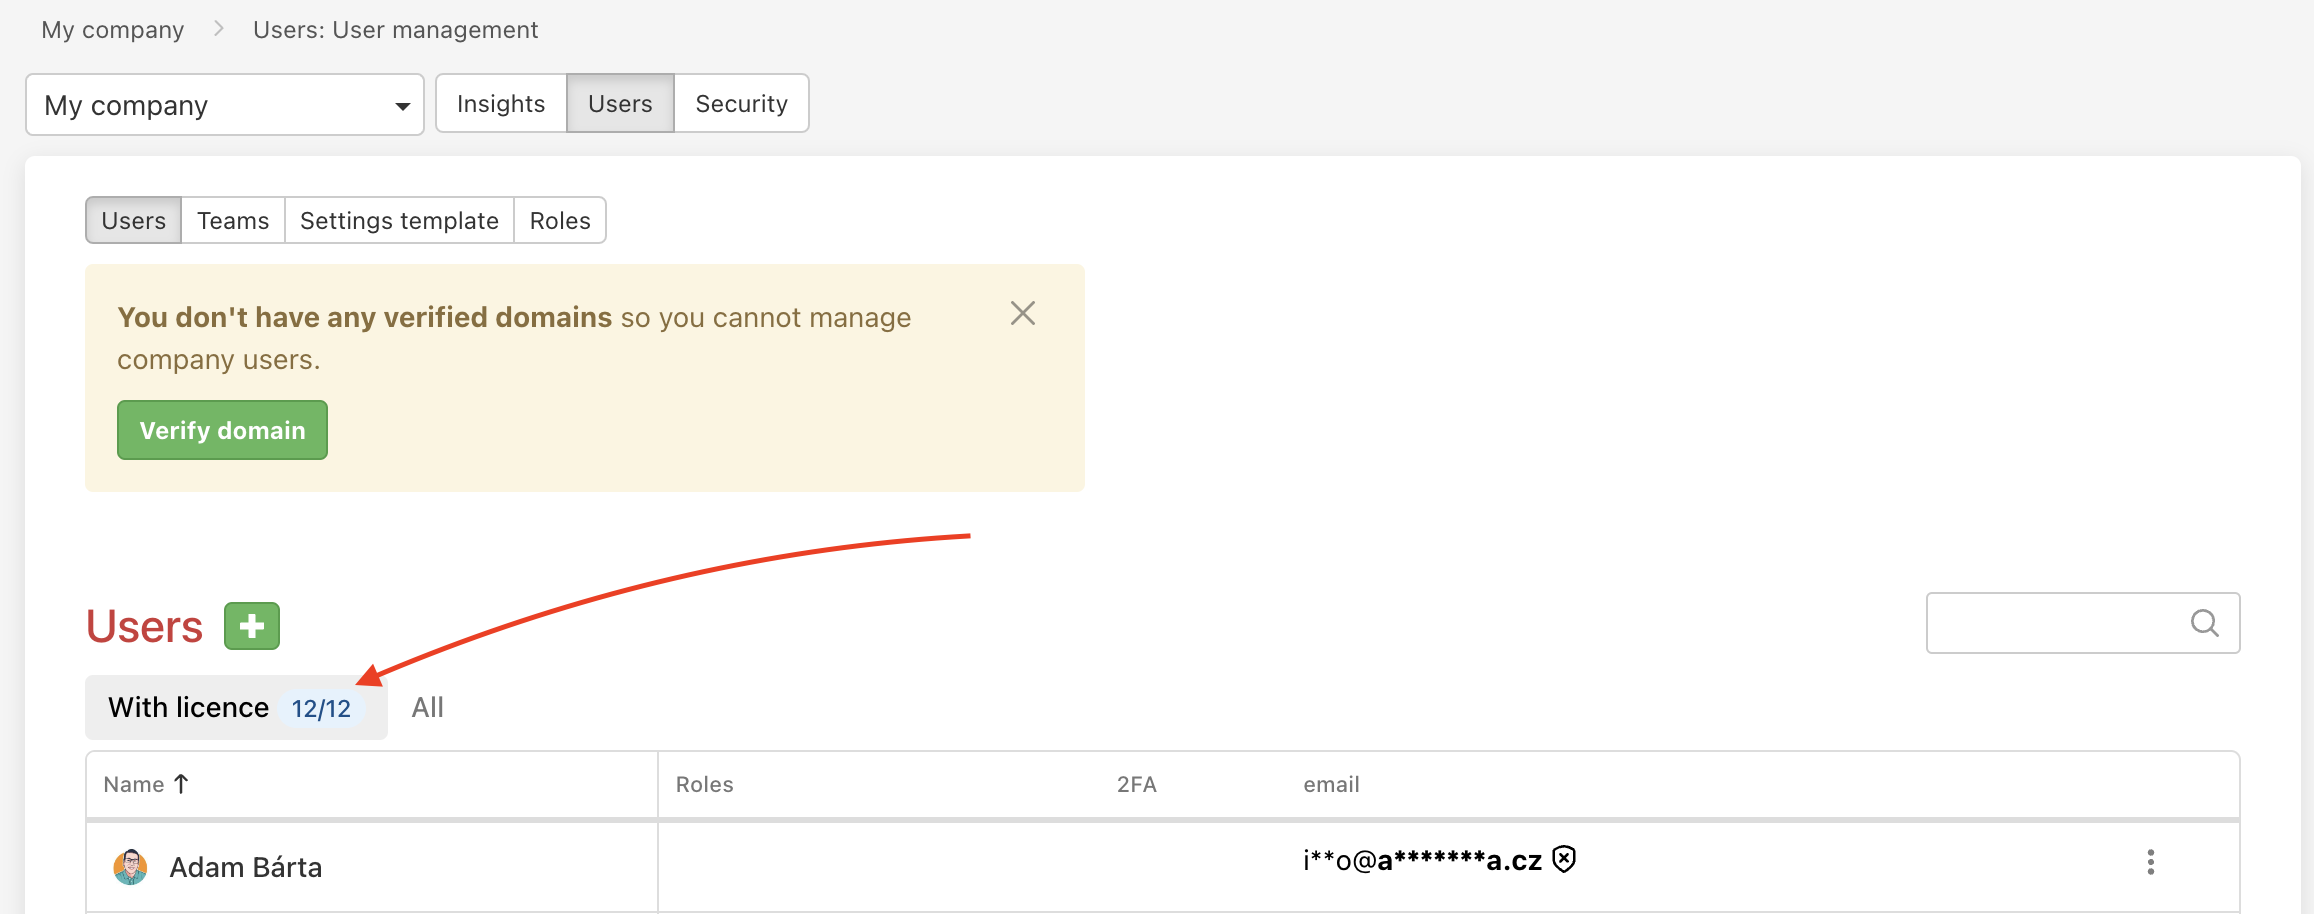
In case you want to check how many licenses you have available or who is invited, you can (as captain or Company Captain) easily switch between With licence and All users.
Setting Notification emails
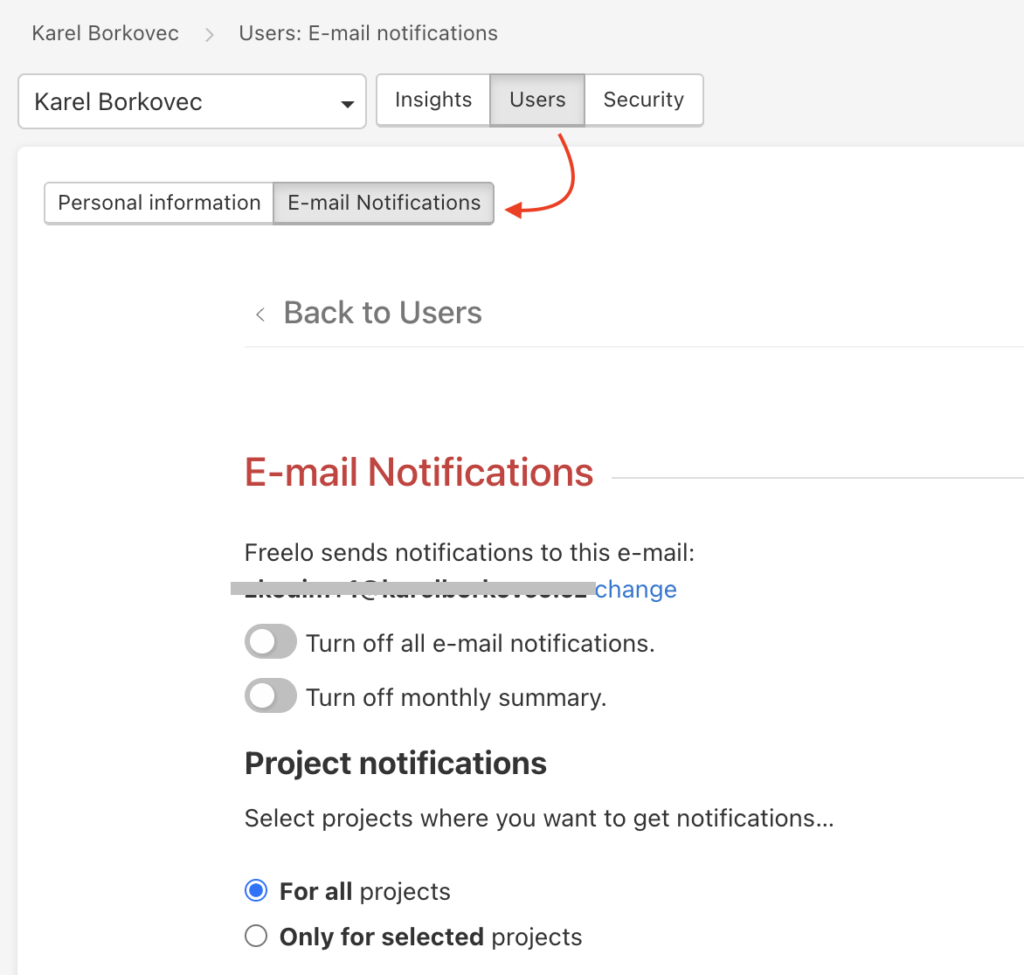
You can select which email notifications the user receives or turn them off completely.
Bulk settings for users
Via the Settings template you can easily set up yourself and selected users with verified domains:
- e-mail notifications,
- project detail layout,
- showing Freelo support chat,
- dark mode.
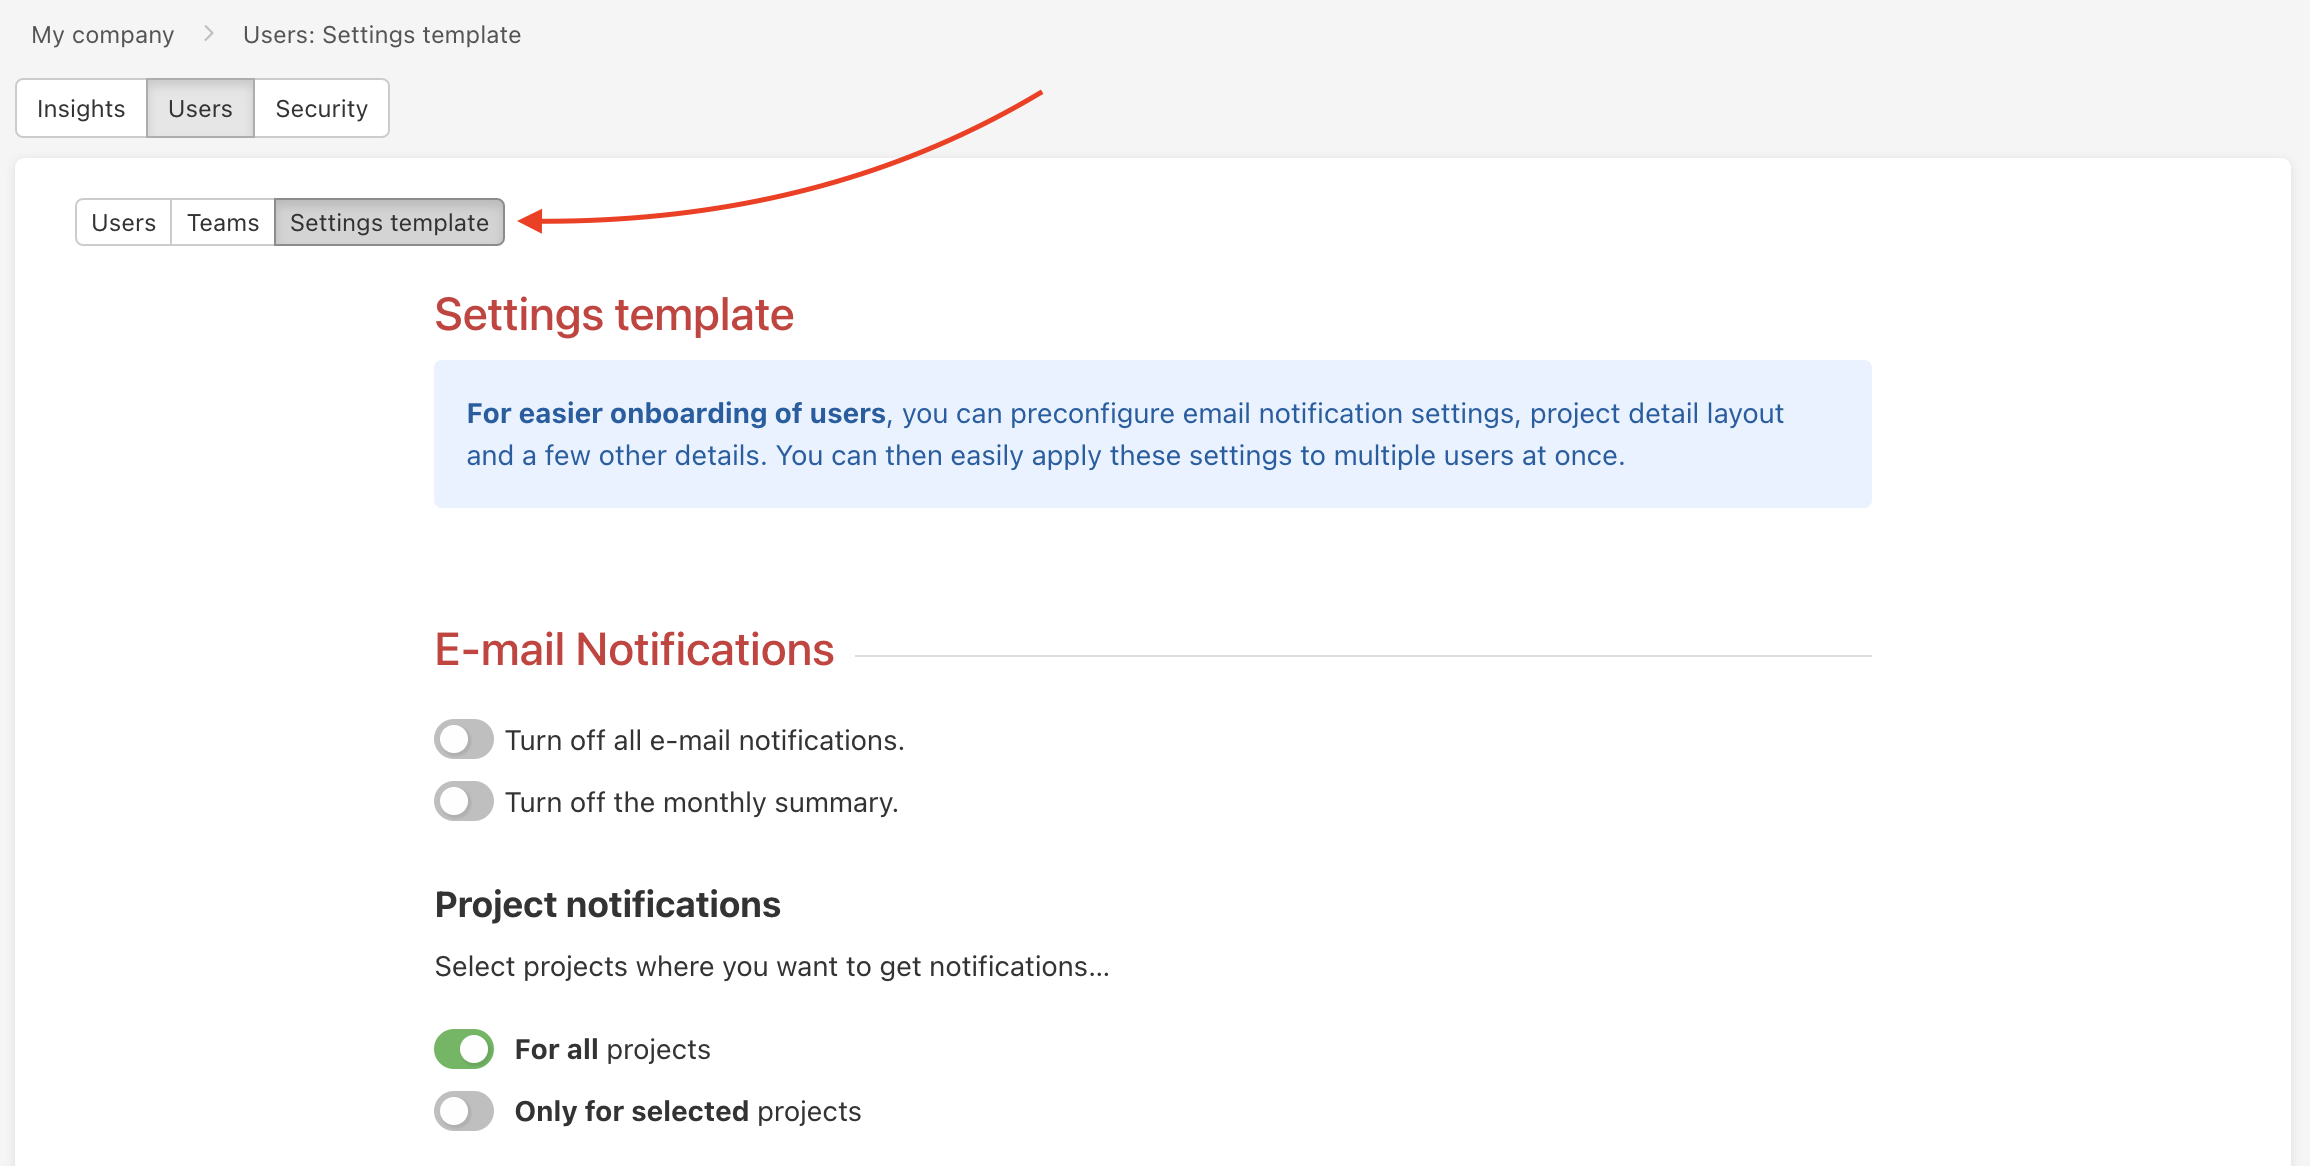
You can save the set template for future use. Or save it and apply it directly to selected users or teams.

3. Teams
In the last tab of the Insights section, you can easily work with teams. For example, do you have a marketing team in your company that you need to tag in a discussion and you don’t want to select all users one by one? Simply create a Marketing team, add the right members and you can start working with the team.
How to create a team
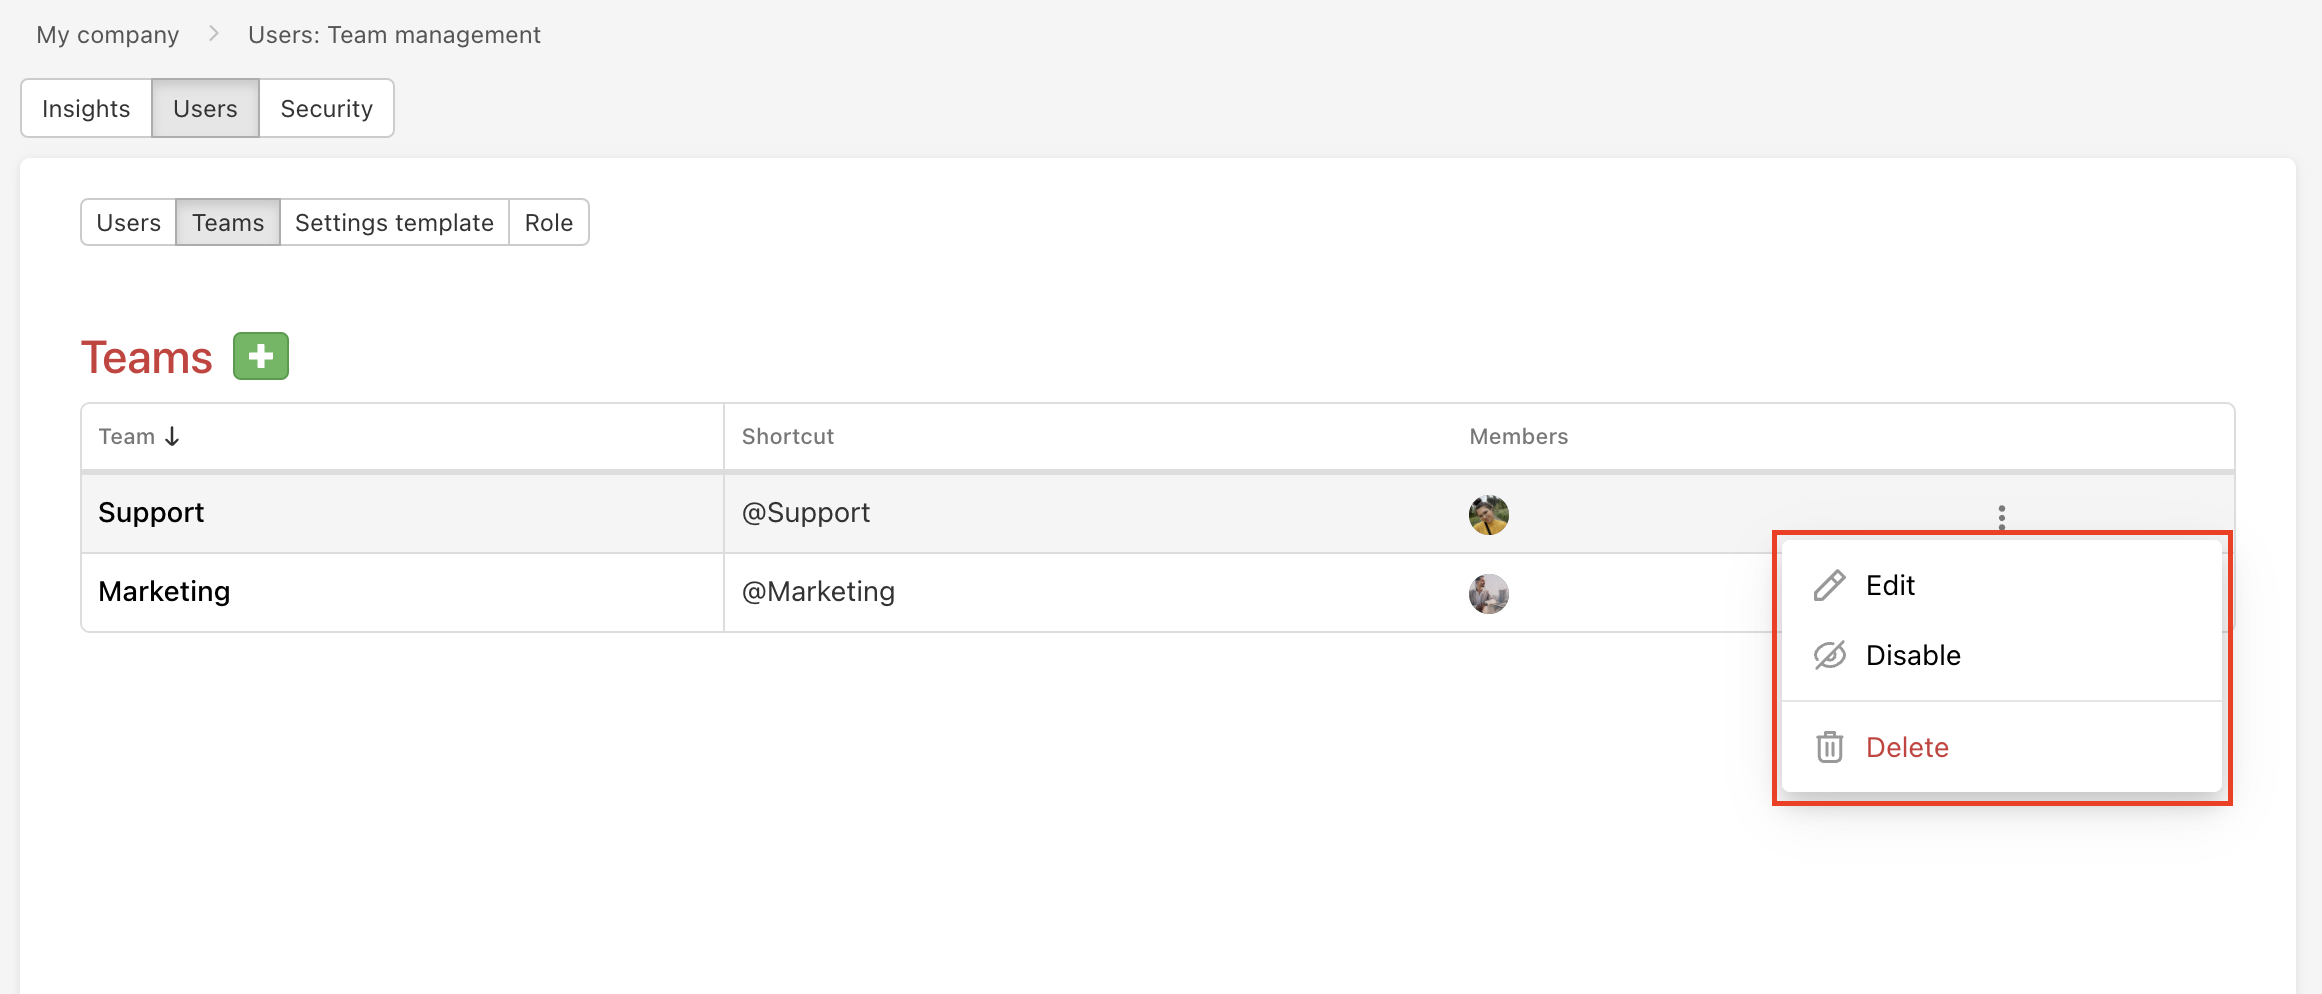
To create a new team, open your Business panel and go to section Users > Teams. Here you click the green ➕ button.
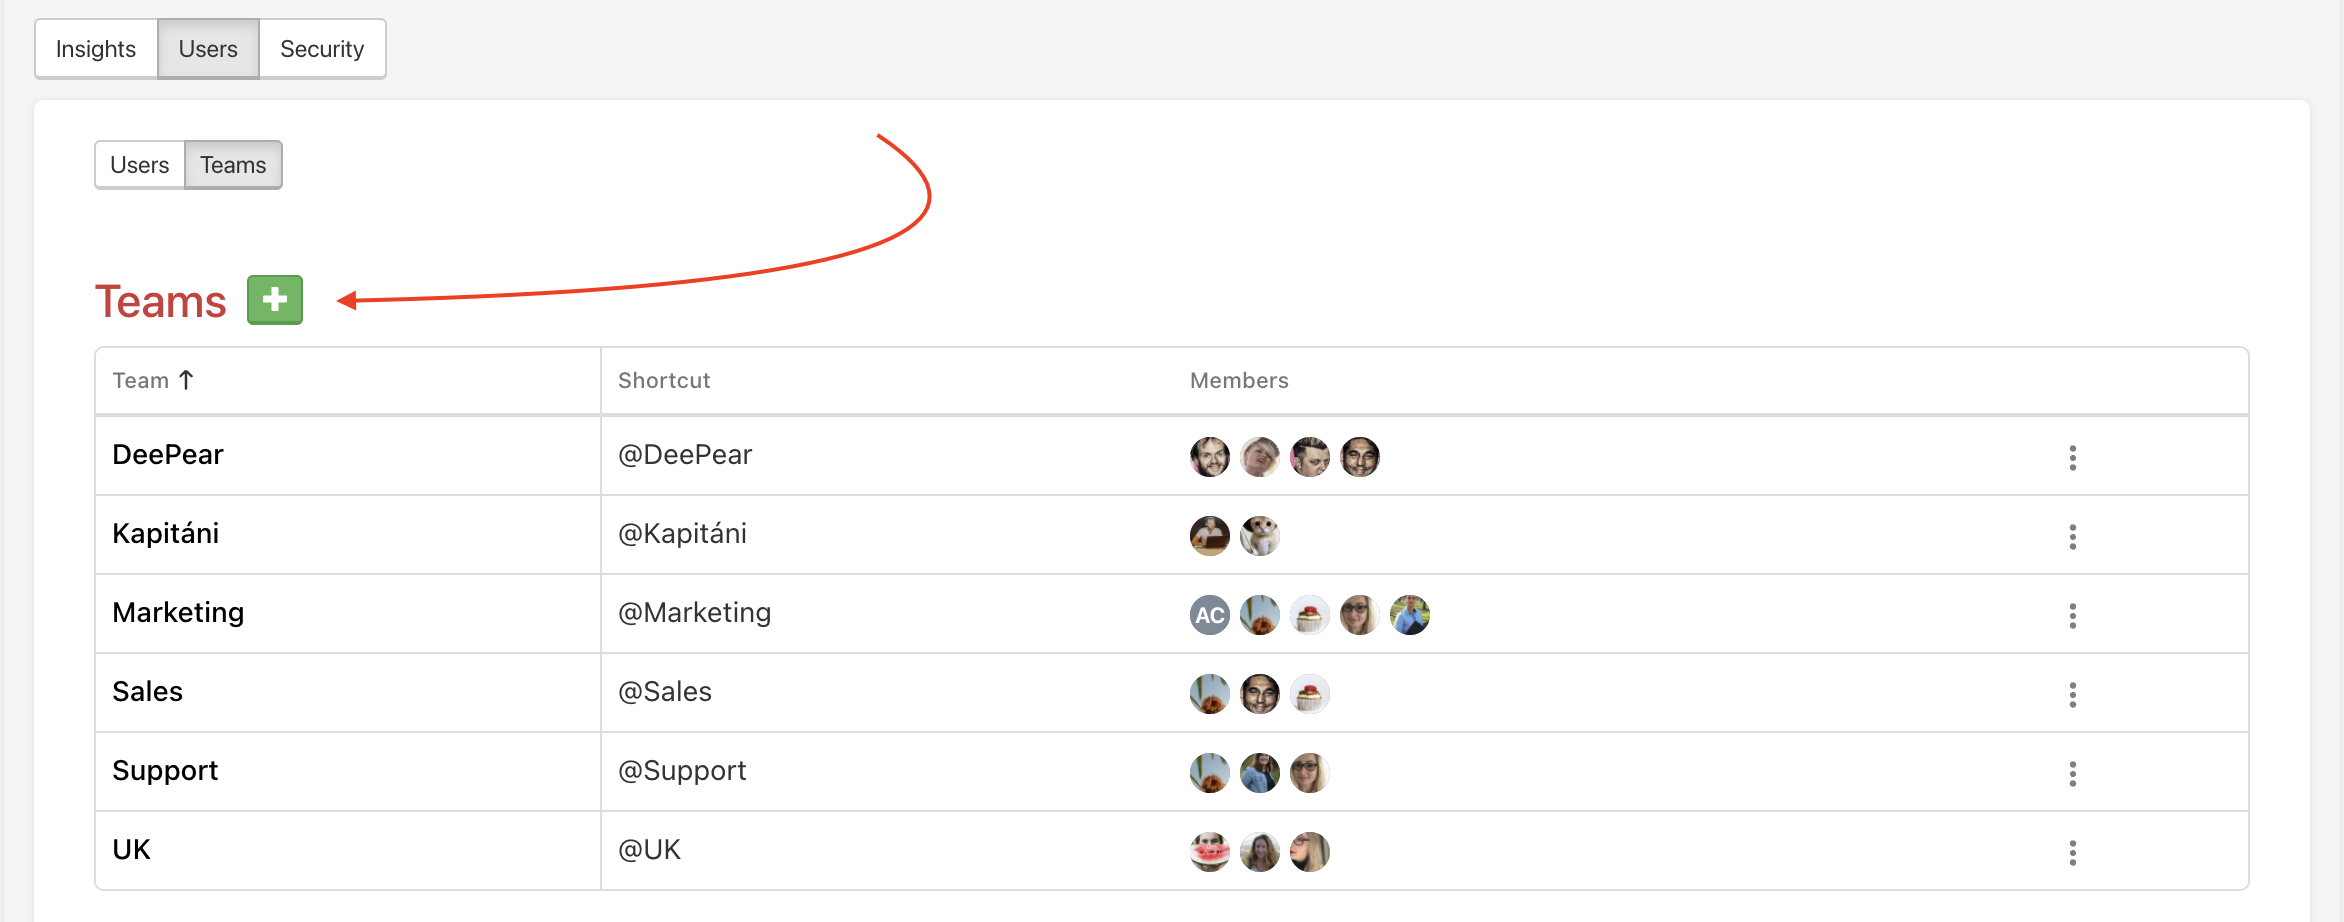
After this modal window appears and you can choose the team’s name and easily select the right members of this team.
You can also edit, deactivate or delete a team in the same place. Just click the three dot menu on the right side of the team’s line.
Team Insights
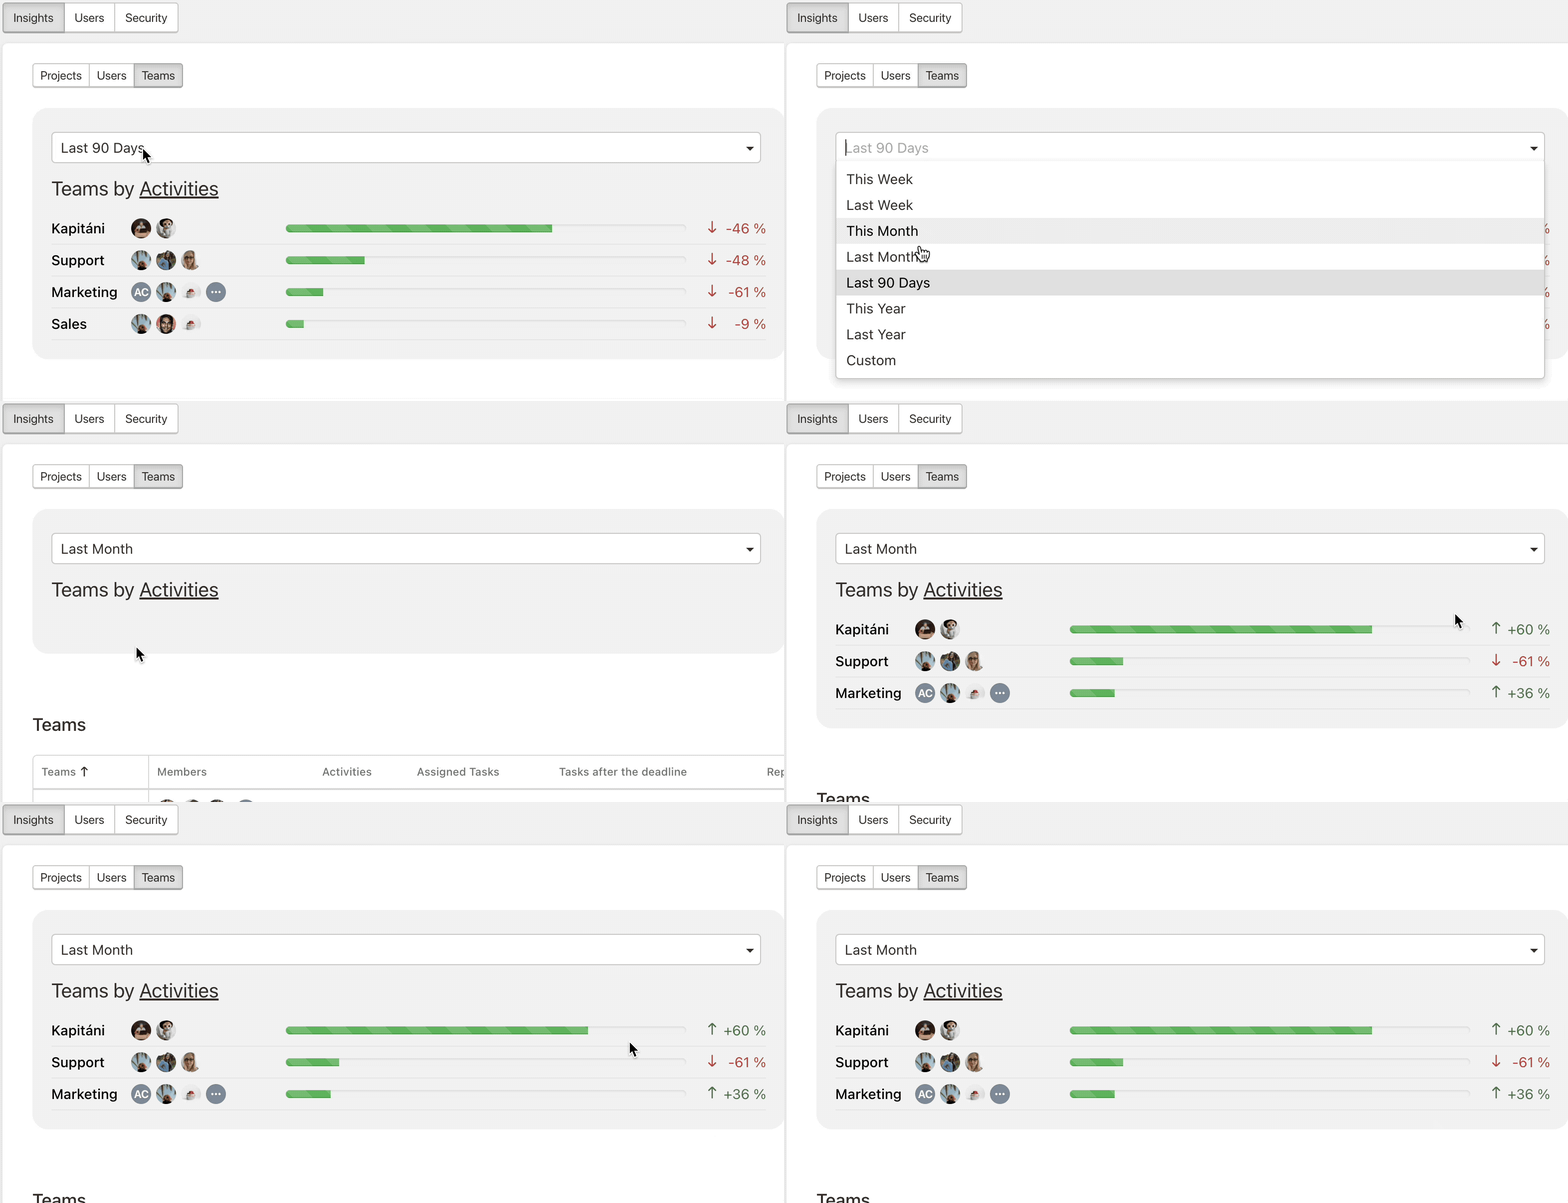
Do you want to know how each team was doing in a specific period? In the section Insights > Teams you can easily filter the specific time which is important for you and see who worked hard and who just went with the flow.
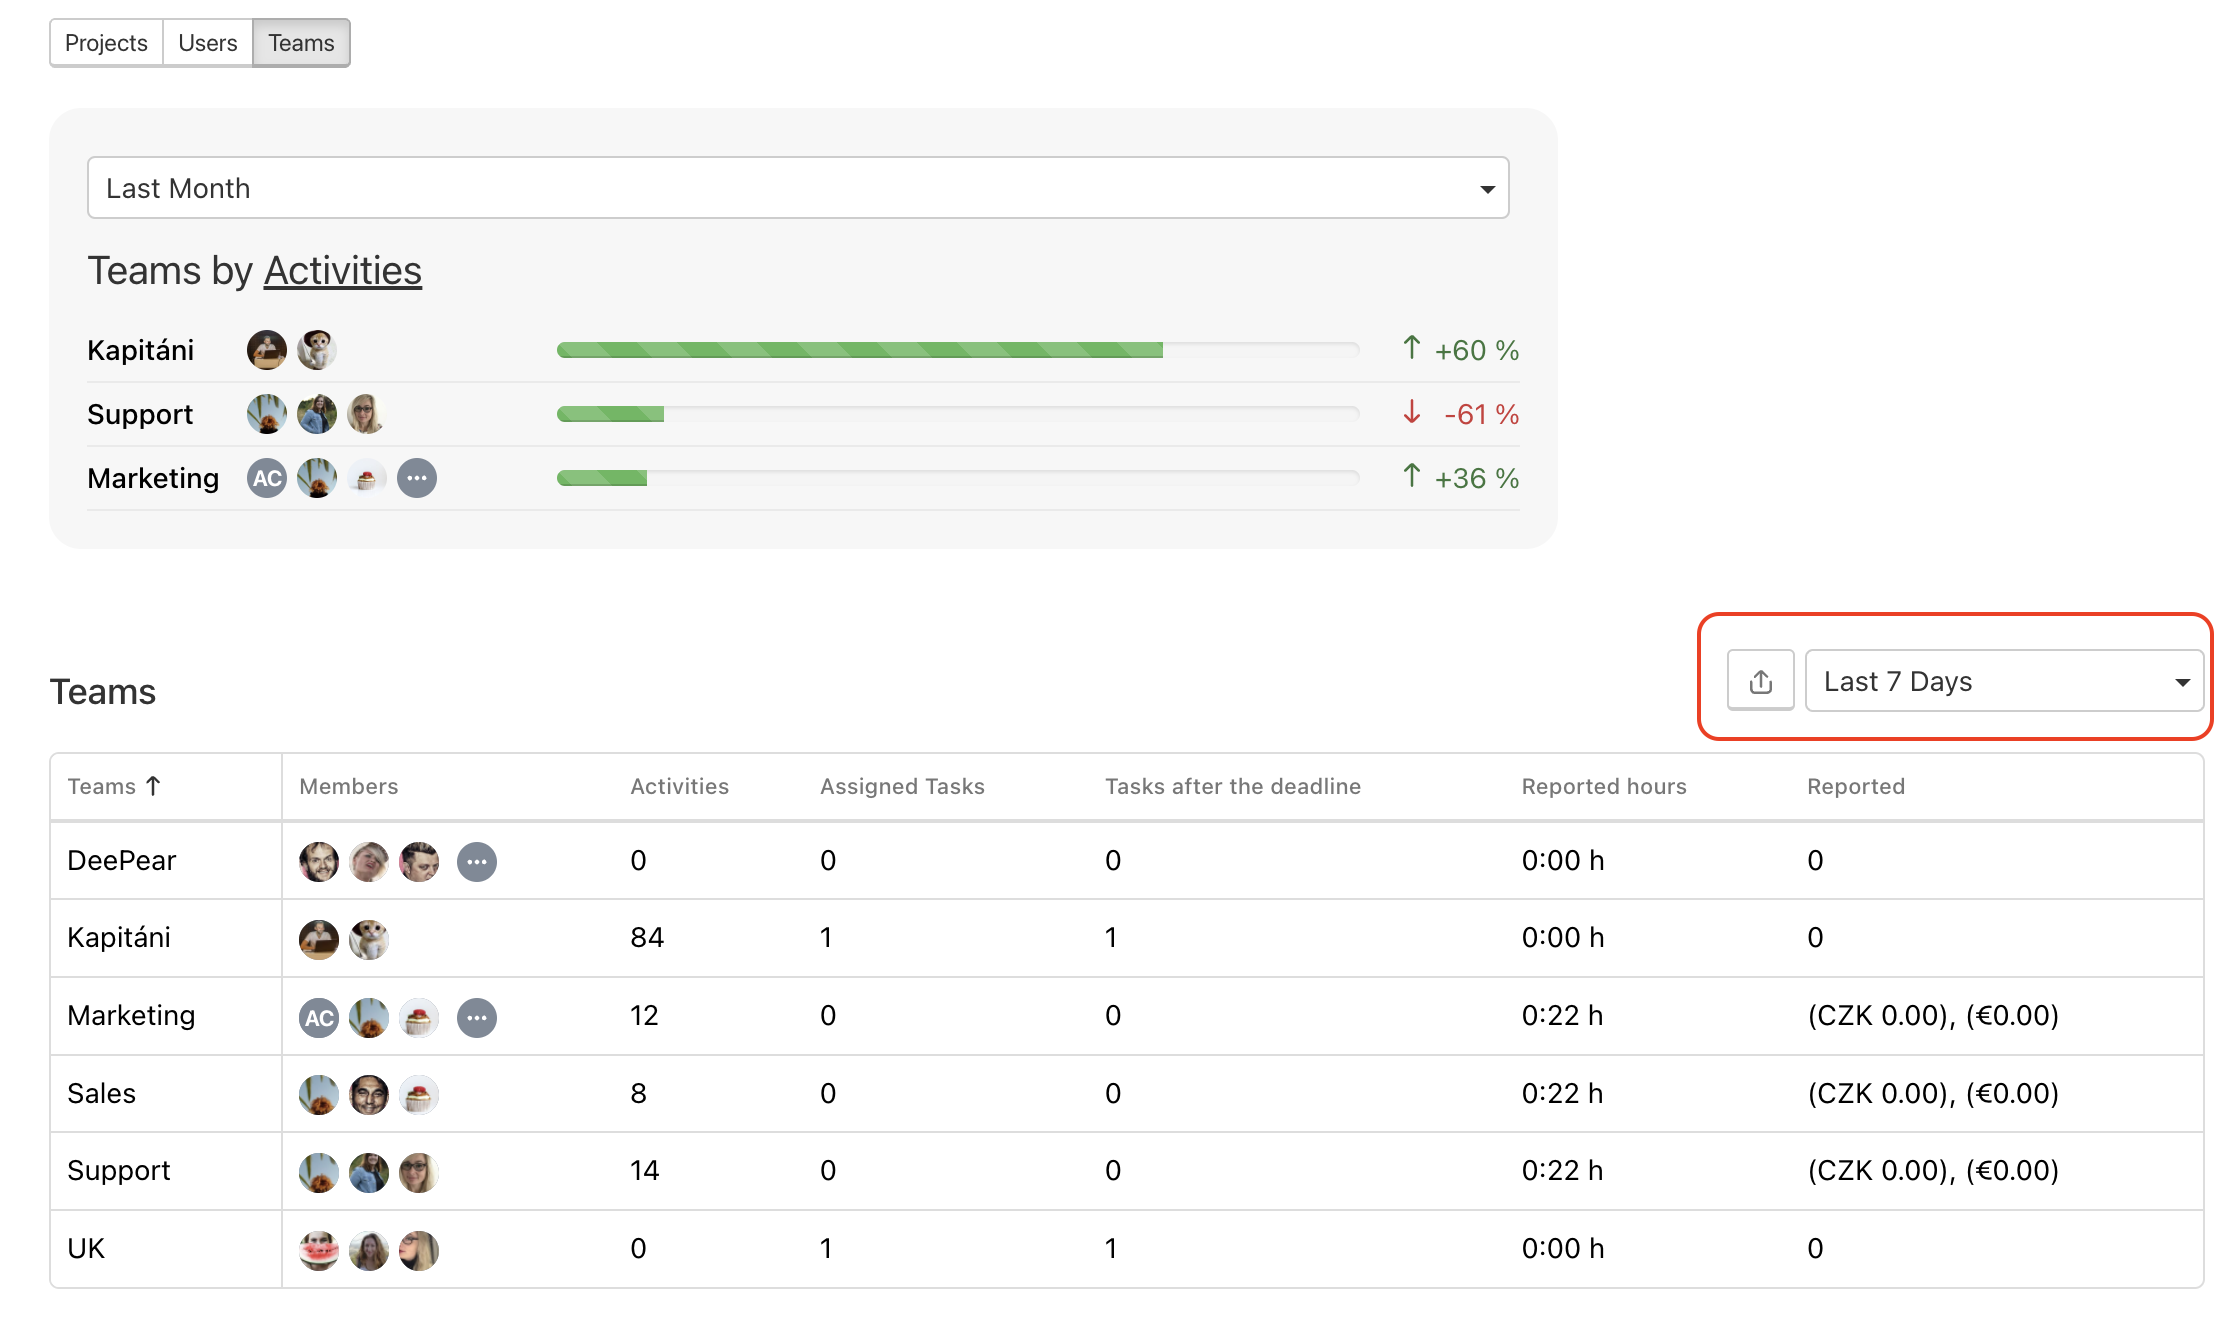
You can also track the following for every team:
- Activities – what the team has done in the selected period. A click will take you to the Reports > Activities section.
- Assigned Tasks – what tasks the team is responsible for. Click on the number will take you to the Dashboard where you can see the tasks in detail.
- Tasks after the deadline – is there anything that the team didn’t manage to finish on time? This is where you’ll see how many tasks they have missed.
- Reported hours – how much has the team worked in the selected time? If you’re interested in more than just the number, clicking here will take you to the Reports > Cost Reports section where everything you need is already filtered.
- Reported – here you will find the data of how much the team has already reported.
You can view all of these data for the selected period.
Other work with teams
You can also work with teams outside the Business panel like this::
- tagging the team in discussion;
- filtering the team on Dashboard or for example in Reports;
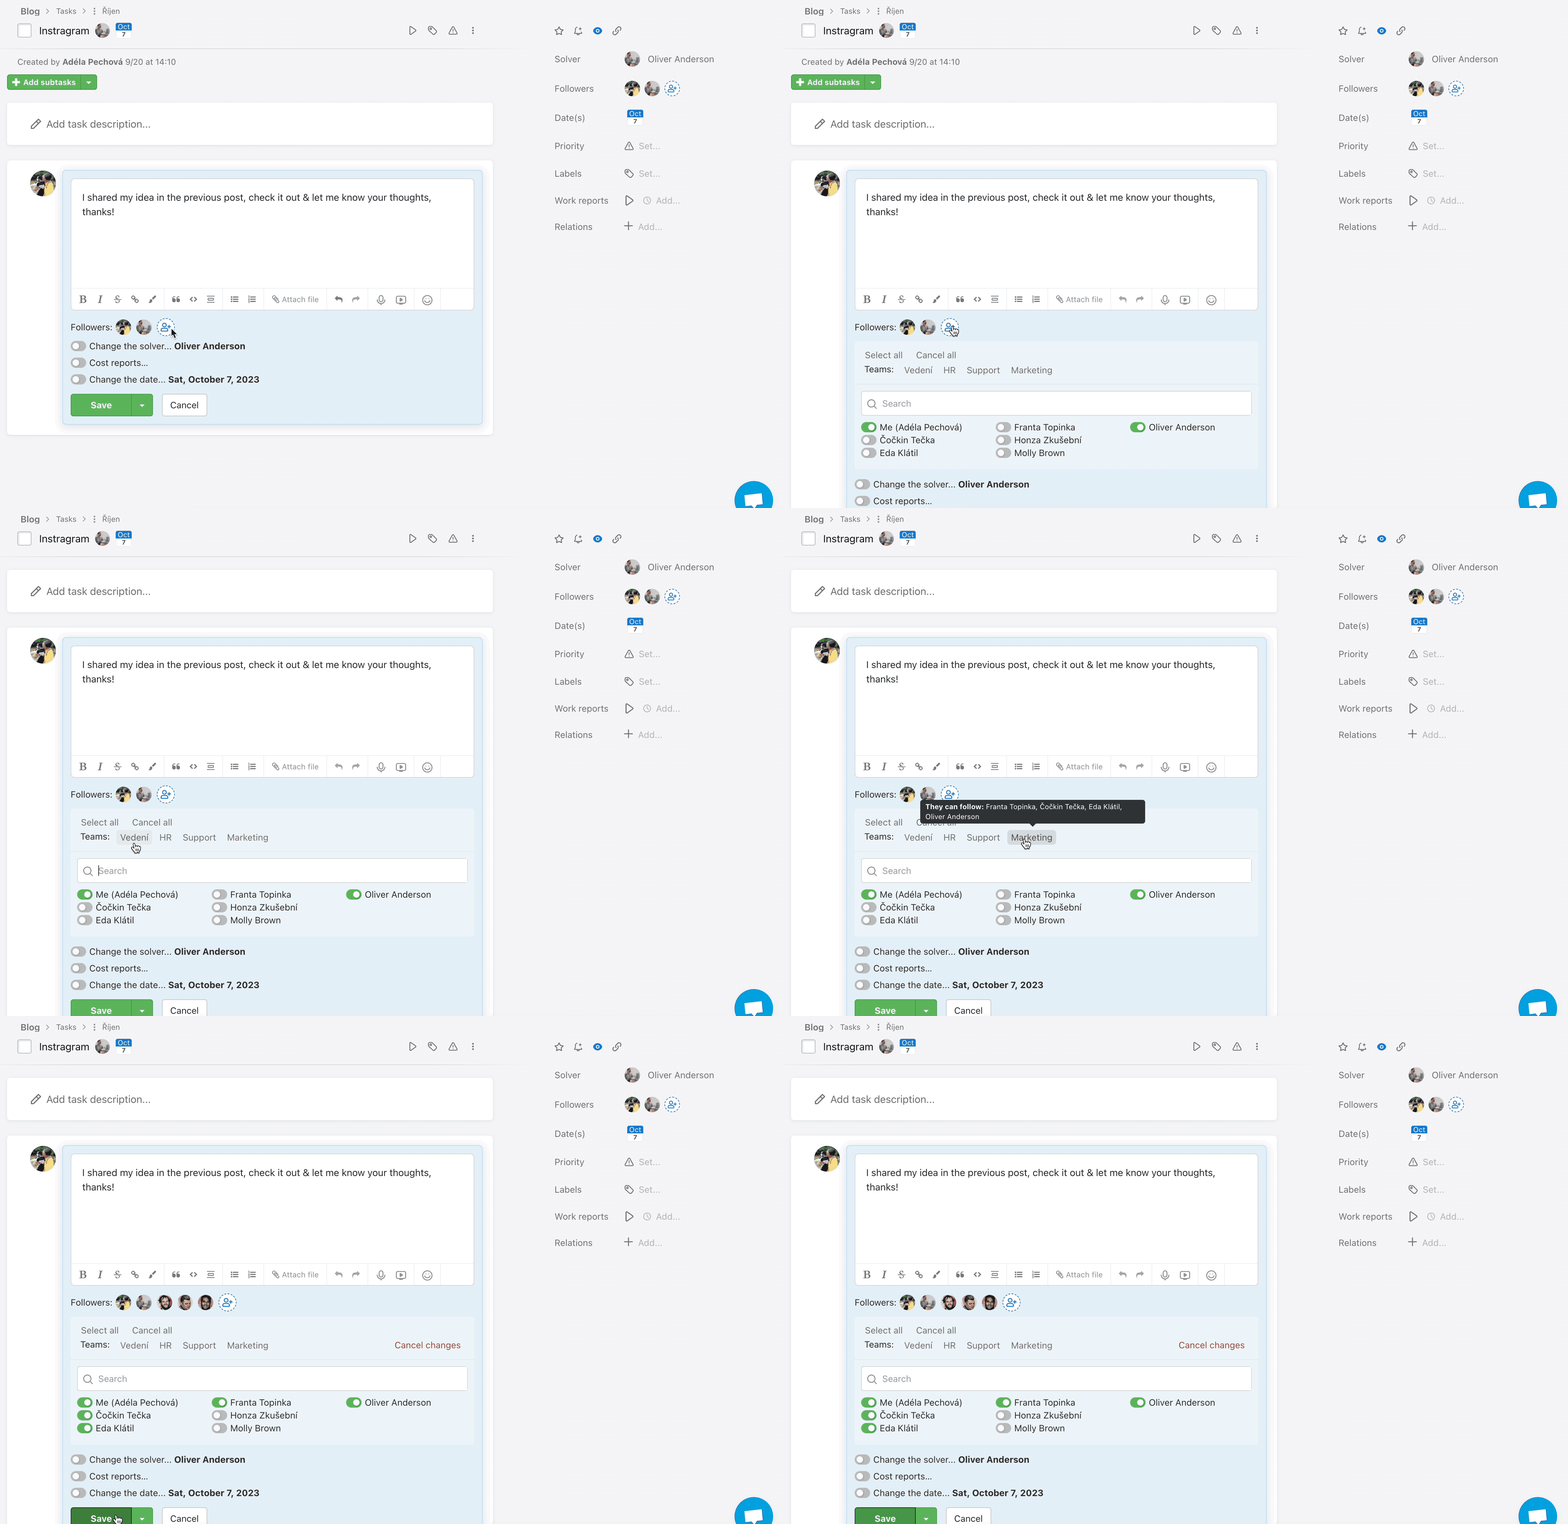
- set all team members as followers with one click.
- invite the whole team to the project at once
