Report of all costs and time at one place. It shows all the important items – working hours and spending money. Take control over your profits and costs. There are many options to filter or change the views according to users, projects and so on.
This report needs you to use time tracking or manual reporting over the tasks first.
You can check:
- What were people working on and for how long.
- How much money or time you spend and for what.
- How much to invoice your clients.
- How much will people invoice you.
- Which activities are (non)profitable.
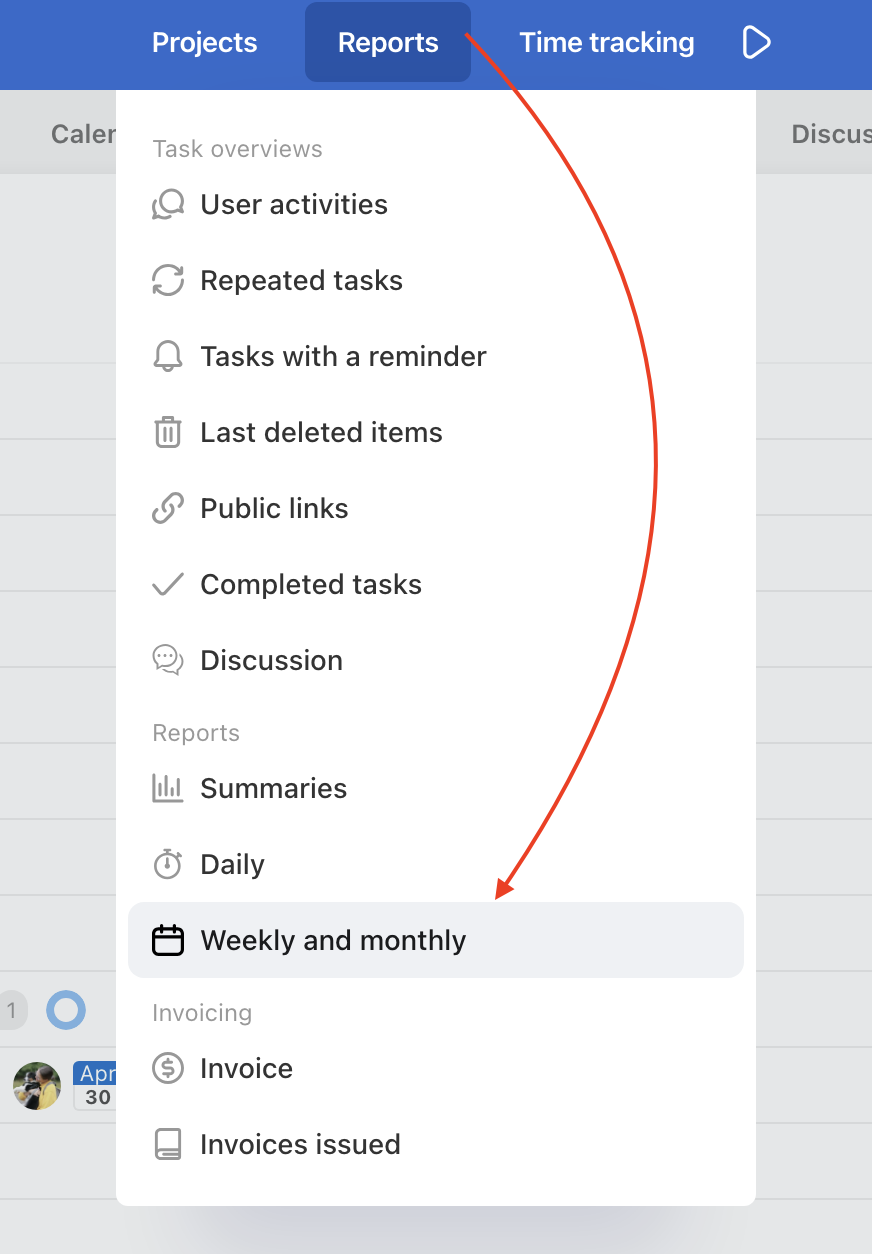
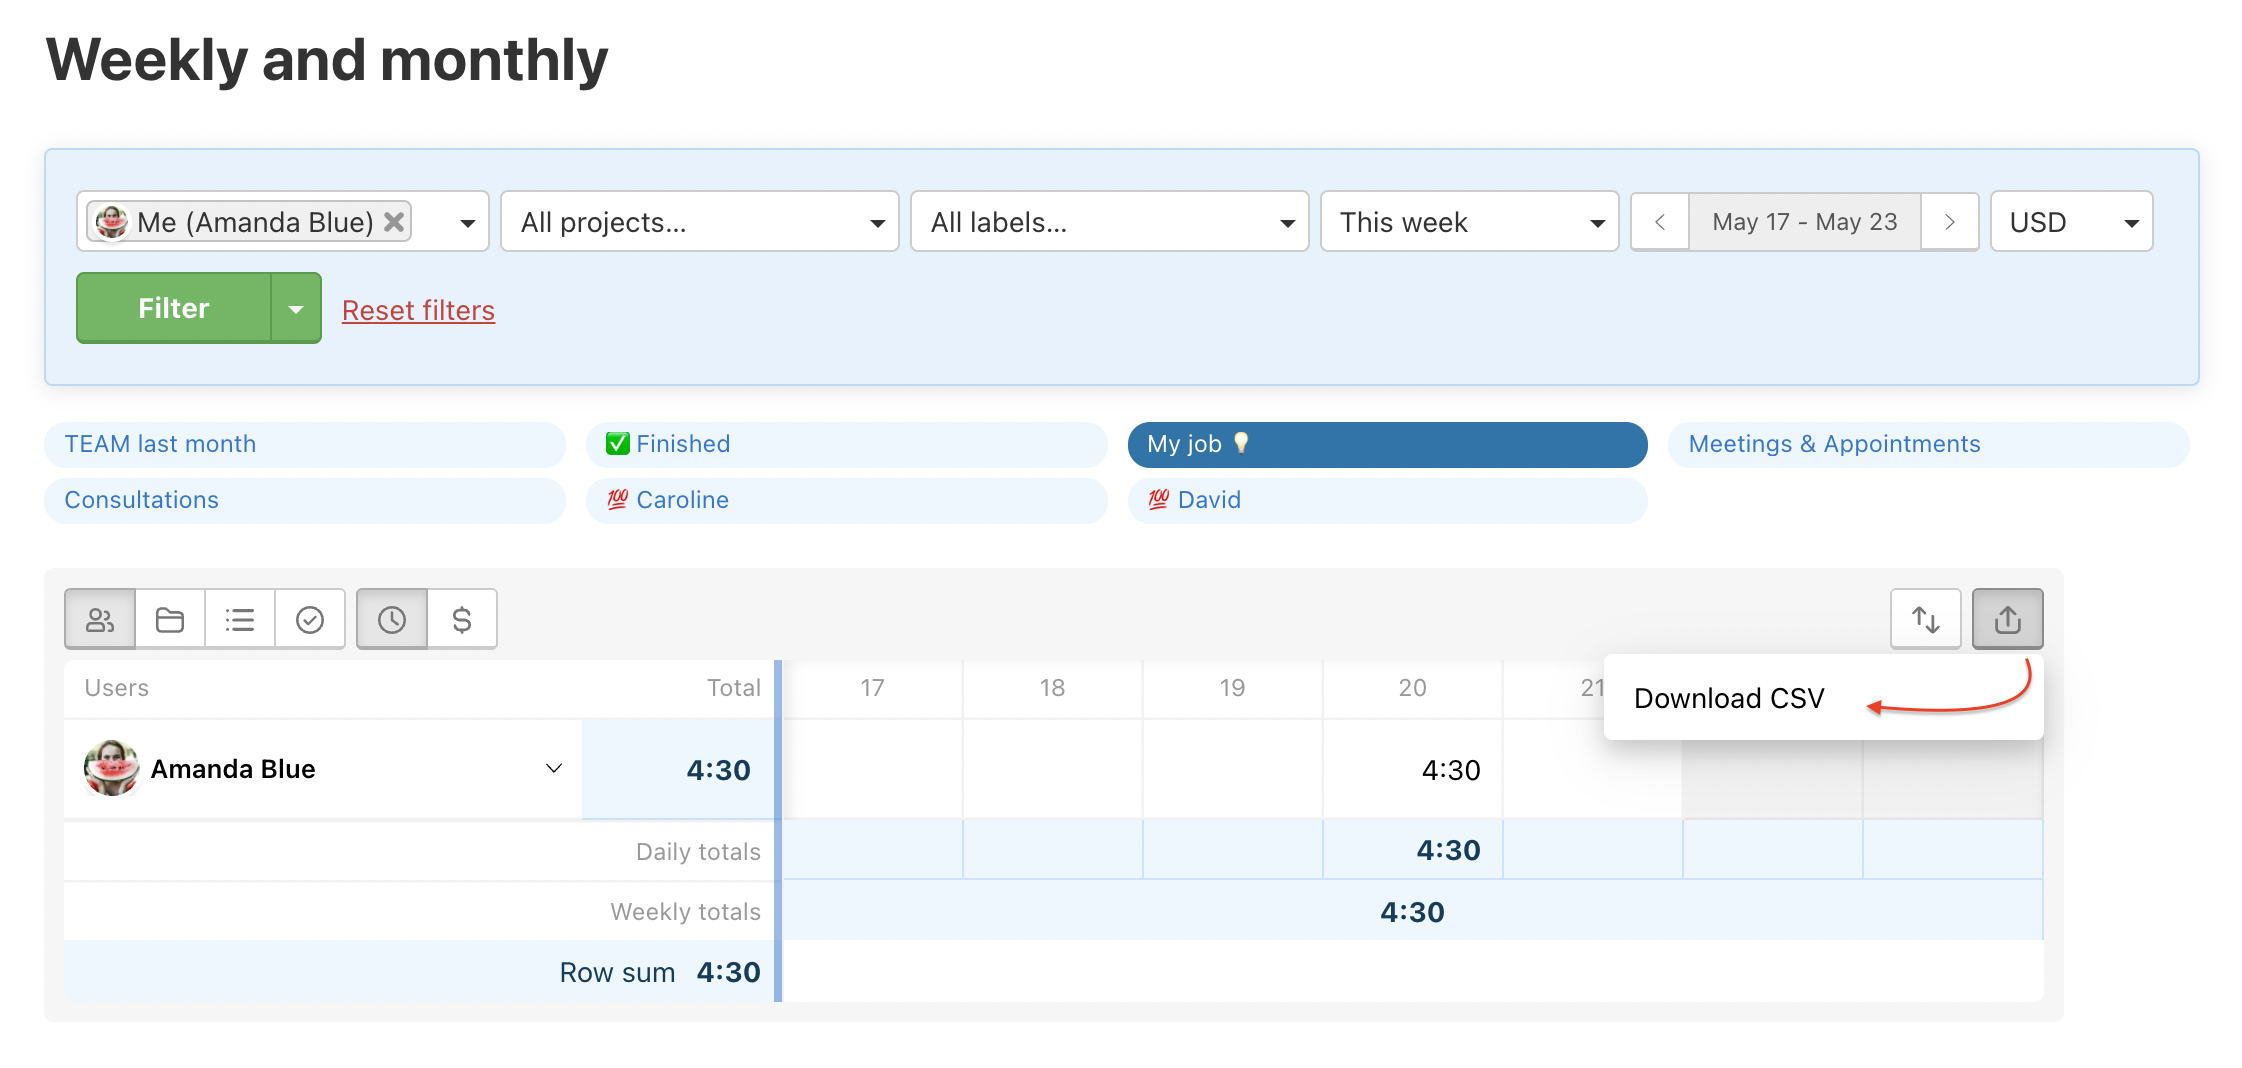
Find the weekly and monthly reports in section Reports > Cost reports > Weekly and monthly.
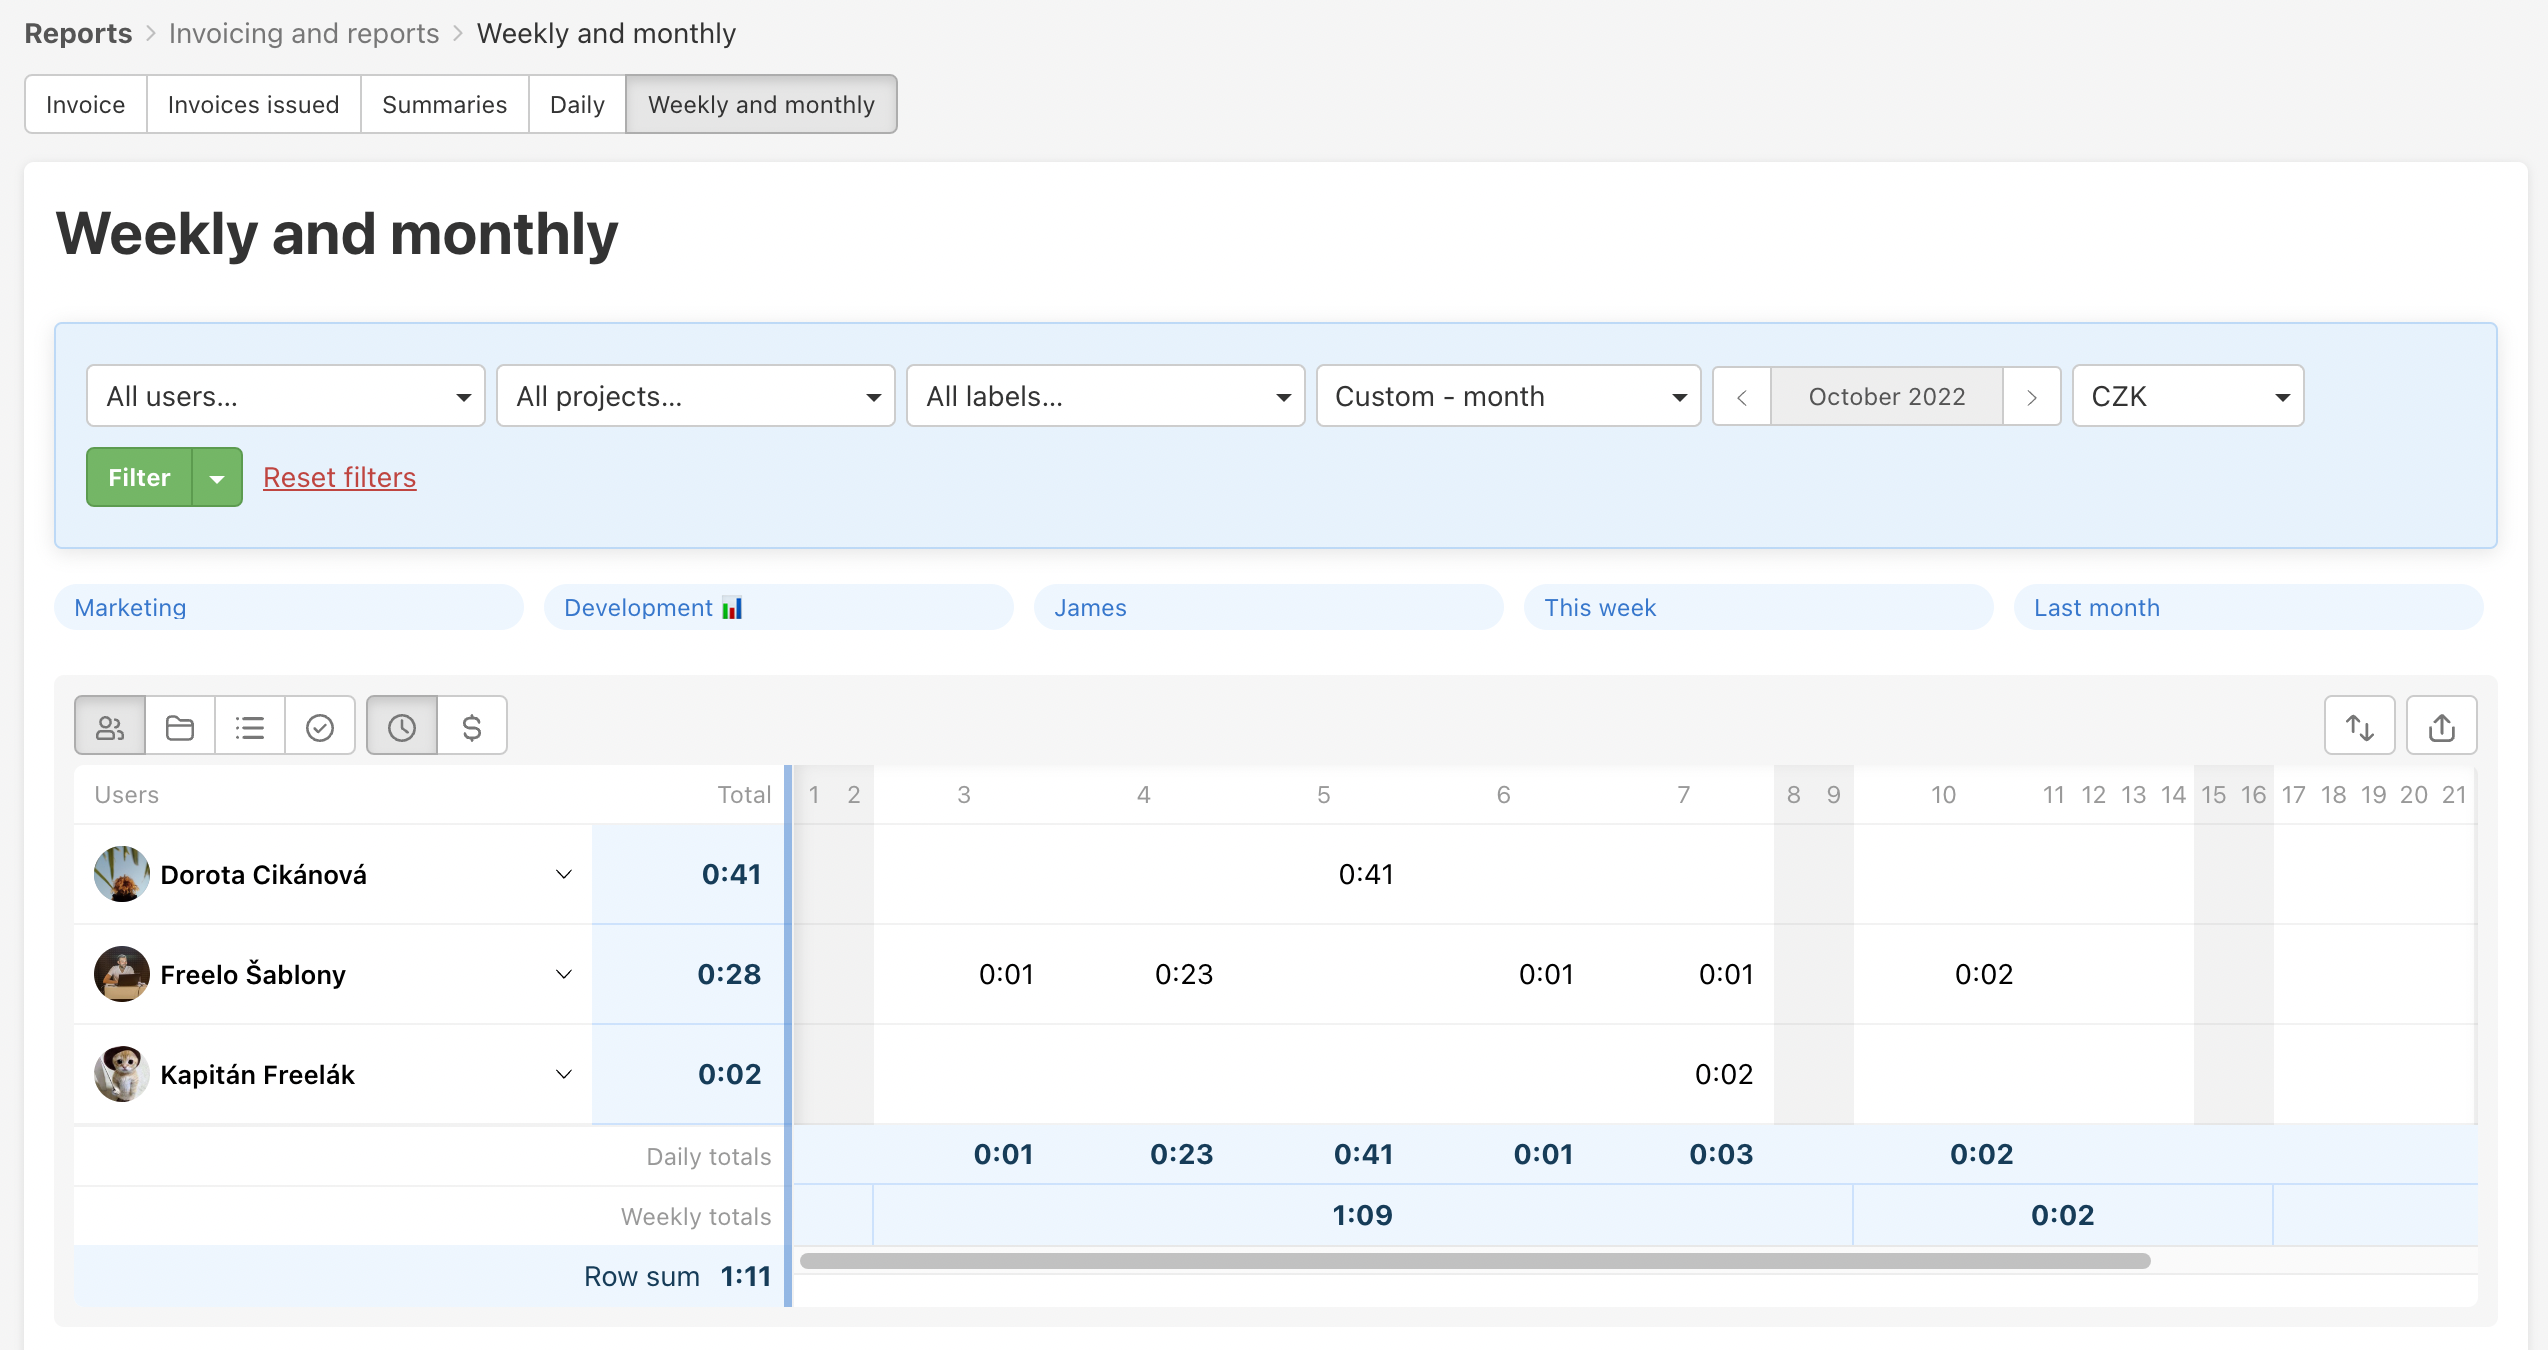
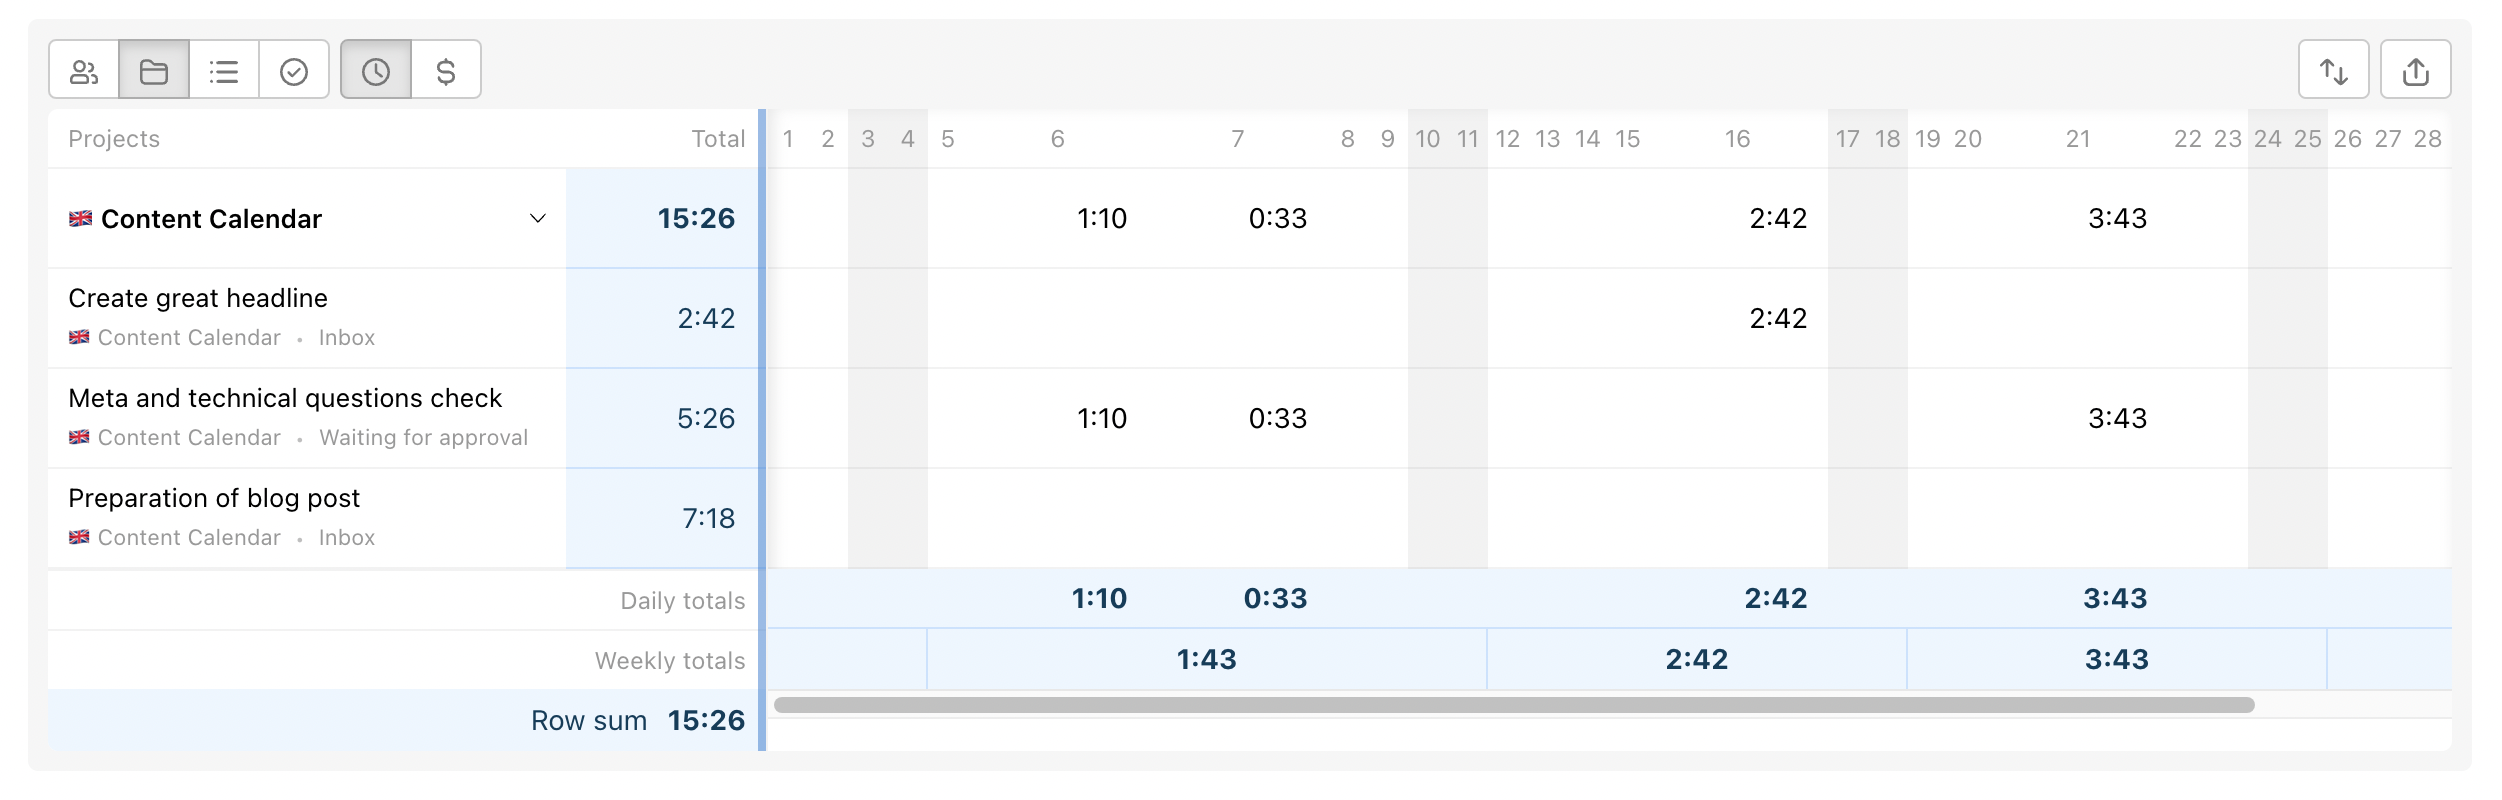
Each day = one white field. There can be day cost or time total or nothing.
Total amount = light blue field. There is total cost or time per particular task / project / To-Do list / user or total per day /week below.
You can filter and group your reports according to users, projects, To-Do lists or tasks. Also by costs or time.
Report views
Do you want to check how your team working? Filter according to users.
- People
- Projects
- To-Do lists
- Tasks
- Time
- Finances
Group reports according to user, project, task or To-Do list via icons in top left corner.
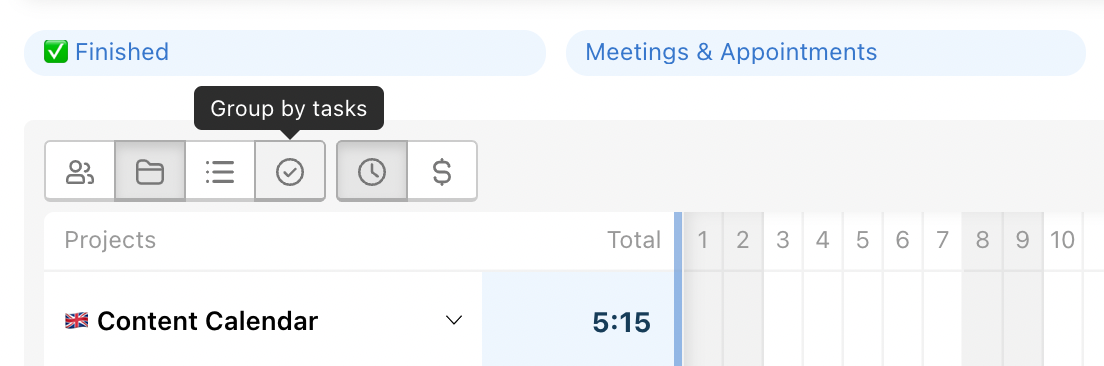
Select whether you want to see reported time or money via clock or dollar icon.
Set up filters
You can save different types of views that you use repeatedly. Name the filter and next time check the reports in one click.
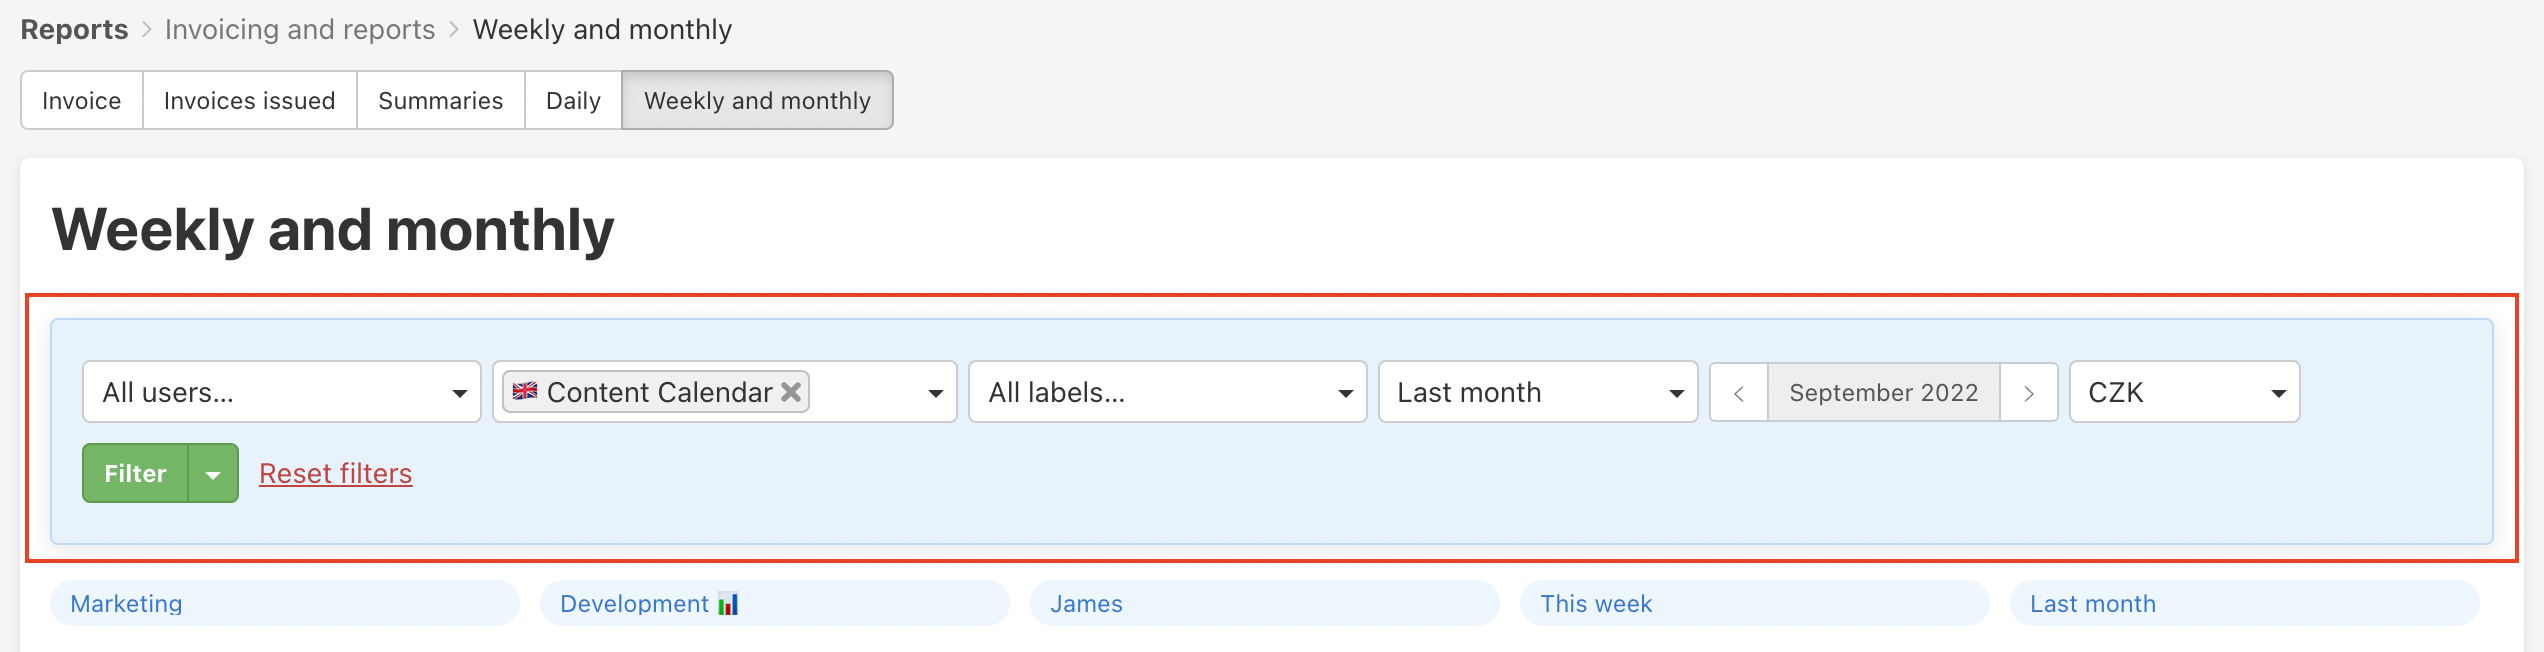
Useful filters:
- Selected people in particular projects last month.
- Particular To-Do list from last week.
- Selected projects last month.
- Tasks with label Done this month.

How to save new filter
Click the arrow icon on the right from the green button Filter > Save filter and name it as you wish.
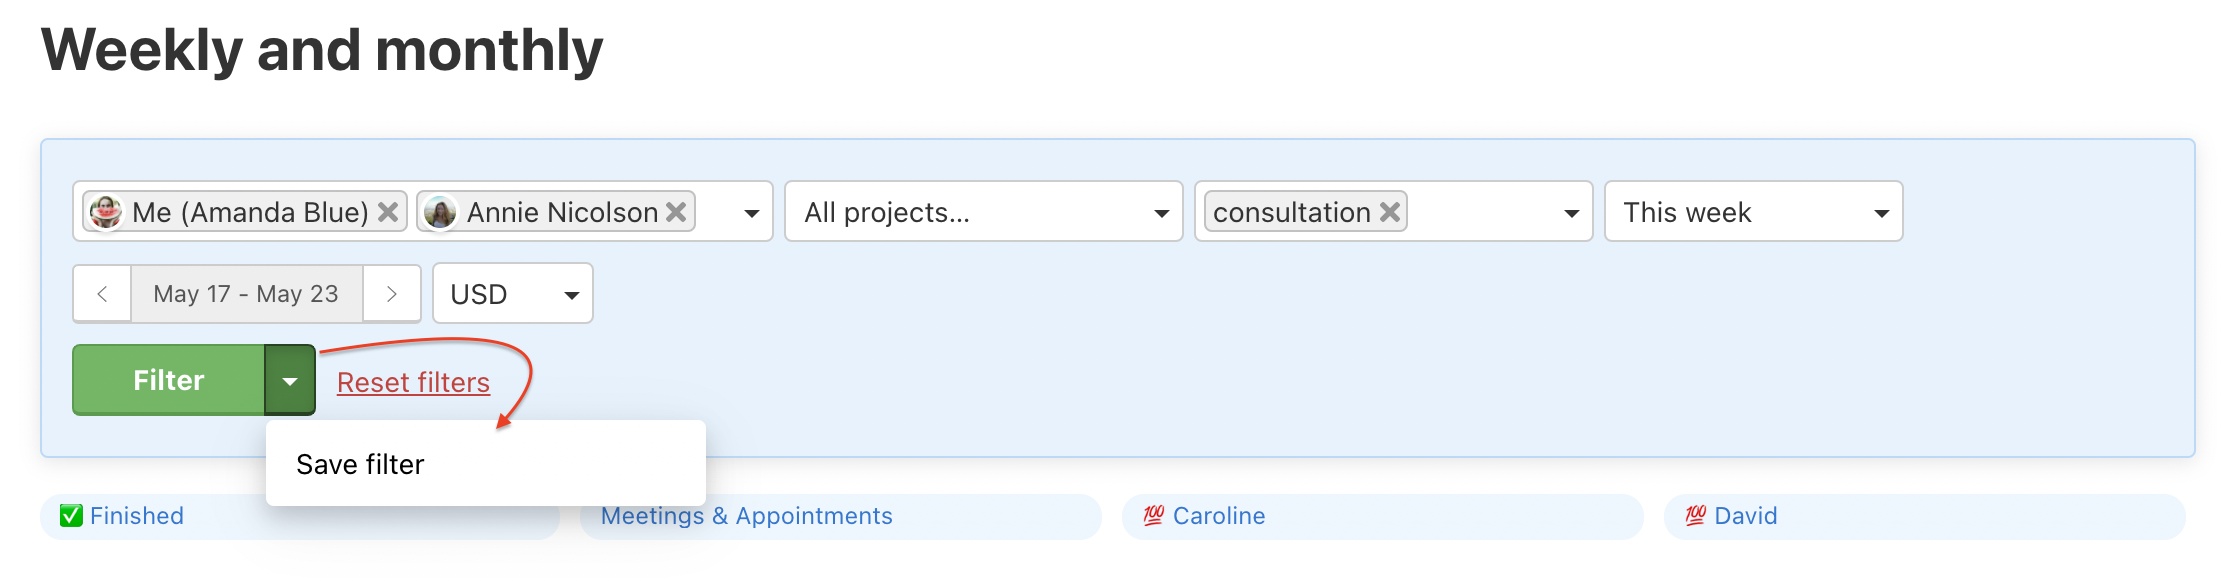
In the following window name the filter and confirm via Save as new filter.
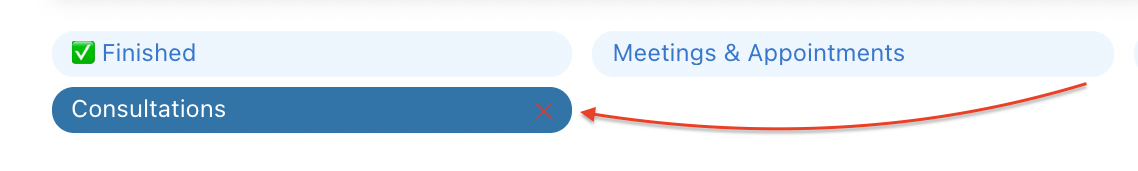
Saved filters
All filters you save are above the report tab and you can quickly change your views.
Edit filter
All filters can be edited. Click the particular filter in the top part where you can again add/delete users, projects or labels. Then click the arrow icon and select Save or edit filter. In the following window Save changes.
Line up filters
All filters you save can be lined up via drag & drop (click with mouse and pull the filter, then drop).
Delete filter
Delete filter via cross icon next to filter name.
Export to CSV
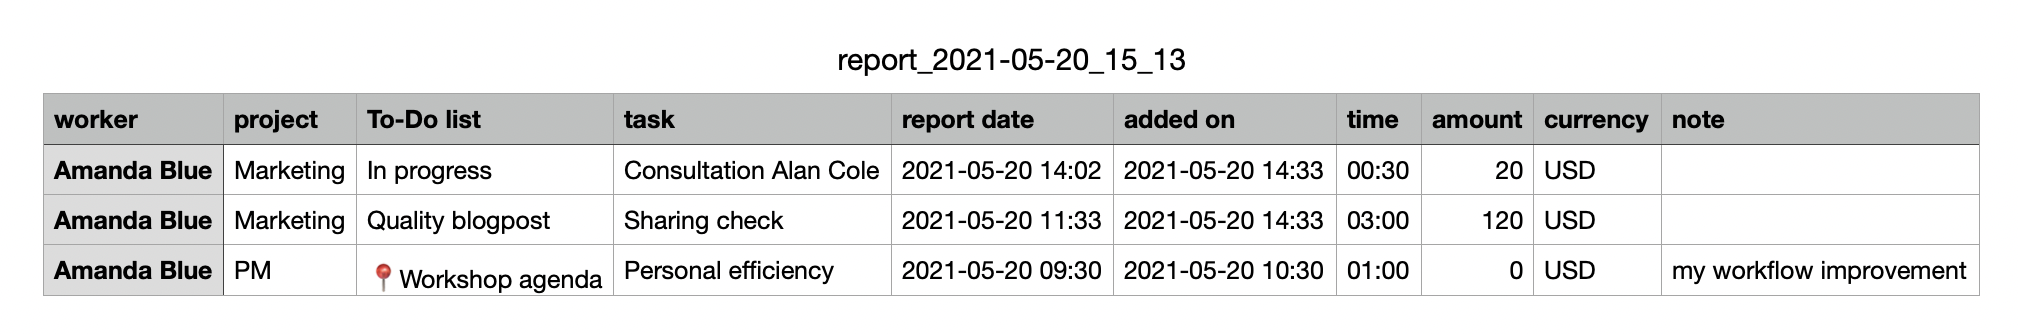
Anything you filter can be downloaded as a CSV file that you can open in Excel or any other chart editor.
Exported reports can be used when invoicing to your client or employer.
In the exported CSV are all necessary details – task, report date, duration, costs and added notes.
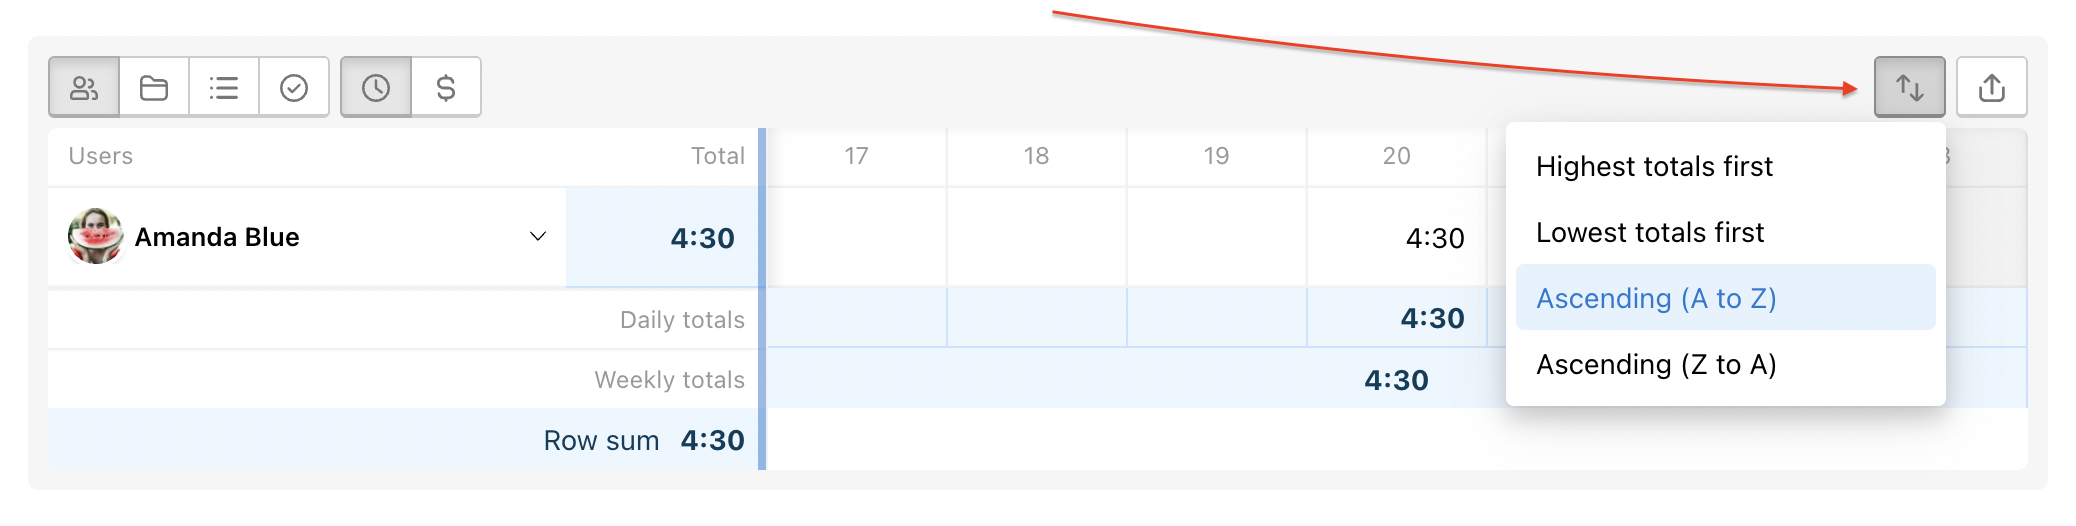
Sort reports
You can sort the order according to the amount or alphabet via the arrows button.